

Genome size evolution in relation to leaf strategy and metabolic rates revisited
- PMID: 17204534
- PMCID: PMC2802952
- DOI: 10.1093/aob/mcl271
Genome size evolution in relation to leaf strategy and metabolic rates revisited
Abstract
Background and aims: It has been proposed that having too much DNA may carry physiological consequences for plants. The strong correlation between DNA content, cell size and cell division rate could lead to predictable morphological variation in plants, including a negative relationship with leaf mass per unit area (LMA). In addition, the possible increased demand for resources in species with high DNA content may have downstream effects on maximal metabolic efficiency, including decreased metabolic rates.
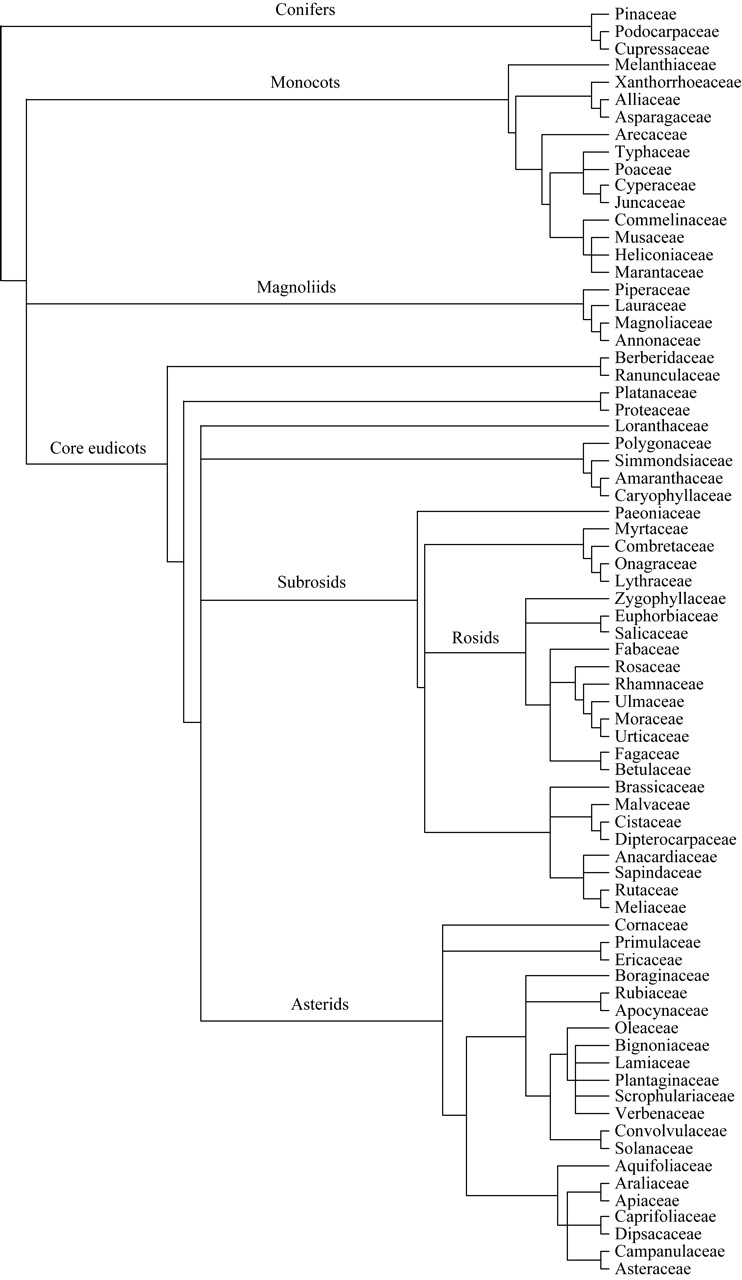
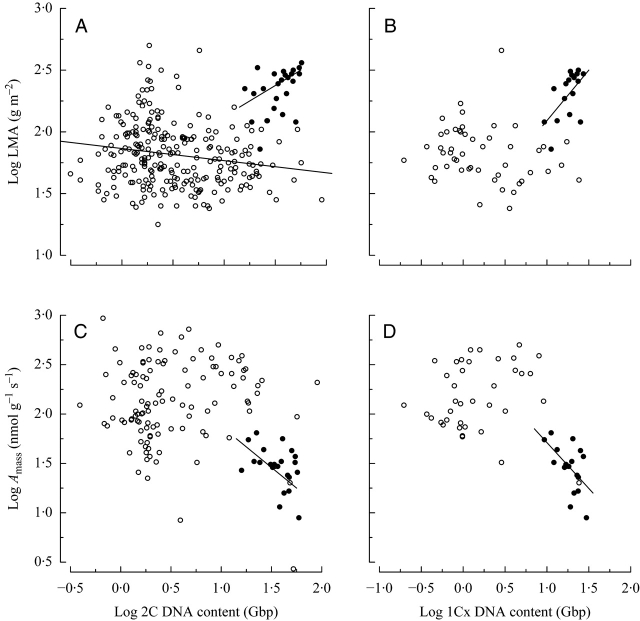
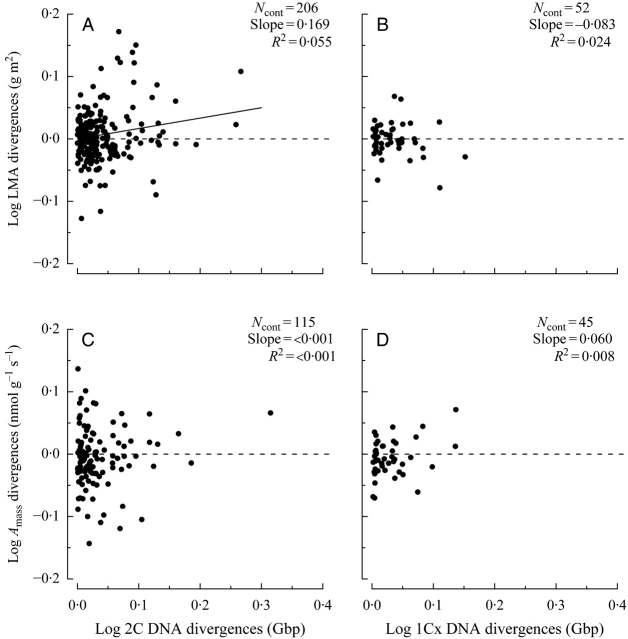
Methods: Tests were made for genome size-dependent variation in LMA and metabolic rates (mass-based photosynthetic rate and dark respiration rate) using our own measurements and data from a plant functional trait database (Glopnet). These associations were tested using two metrics of genome size: bulk DNA amount (2C DNA) and monoploid genome size (1Cx DNA). The data were analysed using an evolutionary framework that included a regression analysis and independent contrasts using a phylogenetic tree with estimates of molecular diversification times. A contribution index for the LMA data set was also calculated to determine which divergences have the greatest influence on the relationship between genome size and LMA.
Key results and conclusions: A significant negative association was found between bulk DNA amount and LMA in angiosperms. This was primarily a result of influential divergences that may represent early shifts in growth form. However, divergences in bulk DNA amount were positively associated with divergences in LMA, suggesting that the relationship may be indirect and mediated through other traits directly related to genome size. There was a significant negative association between genome size and metabolic rates that was driven by a basal divergence between angiosperms and gymnosperms; no significant independent contrast results were found. Therefore, it is concluded that genome size-dependent constraints acting on metabolic efficiency may not exist within seed plants.
Figures
References
-
- Ackerly DD. Analysis of Traits (AOT): a module of Phylocom. 2006 Version 3·1. http://www.phylodiversity.net/phylocom/
-
- Adams KL, Wendel JF. Novel patterns of gene expression in polyploid plants. Trends in Genetics. 2005;21:539–543. - PubMed
-
- Austin RB, Morgan CL, Ford MA, Bhagwat SG. Flag leaf photosynthesis in Triticum aestivum and related diploid and tetraploid species. Annals of Botany. 1982;49:177–189.
-
- Bennett MD. Nuclear DNA content and minimum generation time in herbaceous plants. Proceedings of the Royal Society of London B. 1972;181:109–135. - PubMed
-
- Bennett MD, Leitch IJ. Plant DNA C-values database. 2005a (release 4·0, October 2005). http://www.kew.org/cval/homepage.html . - PubMed
