Meta-Analysis
. 2007 Apr;25(4):961-73.
doi: 10.1634/stemcells.2006-0352. Epub 2007 Jan 4.

A meta-analysis of human embryonic stem cells transcriptome integrated into a web-based expression atlas

Affiliations
Meta-Analysis

A meta-analysis of human embryonic stem cells transcriptome integrated into a web-based expression atlas

Said Assou et al. Stem Cells. 2007 Apr.

Abstract

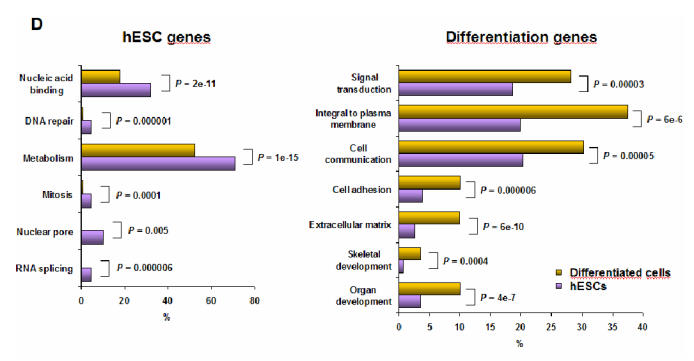
Microarray technology provides a unique opportunity to examine gene expression patterns in human embryonic stem cells (hESCs). We performed a meta-analysis of 38 original studies reporting on the transcriptome of hESCs. We determined that 1,076 genes were found to be overexpressed in hESCs by at least three studies when compared to differentiated cell types, thus composing a "consensus hESC gene list." Only one gene was reported by all studies: the homeodomain transcription factor POU5F1/OCT3/4. The list comprised other genes critical for pluripotency such as the transcription factors NANOG and SOX2, and the growth factors TDGF1/CRIPTO and Galanin. We show that CD24 and SEMA6A, two cell surface protein-coding genes from the top of the consensus hESC gene list, display a strong and specific membrane protein expression on hESCs. Moreover, CD24 labeling permits the purification by flow cytometry of hESCs cocultured on human fibroblasts. The consensus hESC gene list also included the FZD7 WNT receptor, the G protein-coupled receptor GPR19, and the HELLS helicase, which could play an important role in hESCs biology. Conversely, we identified 783 genes downregulated in hESCs and reported in at least three studies. This "consensus differentiation gene list" included the IL6ST/GP130 LIF receptor. We created an online hESC expression atlas, http://amazonia.montp.inserm.fr, to provide an easy access to this public transcriptome dataset. Expression histograms comparing hESCs to a broad collection of fetal and adult tissues can be retrieved with this web tool for more than 15,000 genes.


Figures

Figure 1
Figure 1. Meta-analysis of published “hESC” and “differentiation” gene lists
1959 different genes were found overexpressed in hESCs compared to differentiated tissues by at least two out of 20 independent studies (purple pyramid) (A). Of these, 1076 genes were found by at least three studies, 48 genes by at least 10 studies and only 1 gene (POU5F1) by all studies. Eleven studies provided lists of genes downregulated in hESCs compared to more differentiated samples (yellow pyramid) (B). 1560 genes were found downregulated in hESC by at least two studies, 783 by at least 3 different studies, three by at least 9 different studies and none by all studies. Heat map of gene expression detection for the hESC gene list across 24 hESC and 193 fetal and adult tissues samples analyzed with the U133A microarray (828 probesets) (C). Red stands for a “Present” detection call (i.e. gene expression confidently detected according to the GCOS 1.2 software), grey for “Marginal” and yellow for “Absent”. Cluster a: genes exclusively expressed in hESCs; b: gene expressed in hESCs and central nervous system samples; c: cell cycle genes; d: genes expressed in hESCs and in most tissues analyzed. The clustering was carried out using the Cluster and Treeview software. Only genes were clustered. hFF: human foreskin fibroblasts; OV: ovary; CNS: central nervous system; PNS: peripheral nervous system; SK: skin and keratinocytes; LU: lung; DT: digestive tract; TH: thyroid; AD: adipocytes; K&P: kidney and prostate; H&M: heart and muscle; HEMATO: various hematopoietic tissues; UT: uterus; PL: placenta. Comparison of GO annotations between hESC genes and differentiation genes (D). We compared the frequency of GO annotations of genes overexpressed in hESCs to those underexpressed in hESCs. The statistical analysis was carried out using the Babelomics webtool (http://babelomics.bioinfo.cipf.es/). Histograms show the percentage of genes with the specified GO annotation in the group of genes overexpressed in hESCs (purple) or in differentiated tissues (yellow). P : adjusted FDR P-value.
Figure 2
Figure 2. CD24 and SEMA6A are two new hESC markers
Expression histograms of CD24 across the U133A compendium (A). These histograms were obtained from our Amazonia! website from the U133A oligonucleotide microarray (Affymetrix) datasets. The Y-axis features the signal value obtained with GCOS 1.2 software. Microarray expression histograms of CD24 gene before and after non-lineage differentiation into EBs (data from the study of [56]) (B). Mean U133A microarray signal value of CD24 (C) and CD44 (D) in 24 hESC samples versus two human fibroblasts samples. Flow cytometry analysis of CD24 on HUES1 hESCs co-cultured with hFF (E), of hFF alone (F) and of CD44 on hFF alone (G), and double CD24 and CD44 labeling of HUES1 (passage 37), HUES3 (p43), HS235 (p30) and HS293 (p68) cells co-cultured with hFF (H). Expression histogram of SEMA6A (I). Microarray expression histograms of SEMA6A gene before and after differentiation into EBs (data from the study of [56]) (J). Mean U133A microarray signal value of SEMA6A in 24 hESC samples versus two human fibroblasts samples (K). Indirect immunofluorescence localization of SEMA6A, POU5F1/OCT3/4, or both and corresponding Hoechst nuclear staining in the HUES1 (L) and HUES3 hESCs (M) cultured on murine embryonic and human fibroblasts, respectively. Scale bar: 25μm. White arrow: MEF (L) or hFF (M).
Figure 3
Figure 3. Expression of selected genes using Amazonia!
Expression histograms of five hESC specific genes (POU5F1, NANOG, GPR19, HELLS and CYP26A1), two genes expressed in nonlineage-differentiated hESC cells (HAND1 and IGF2), two factors highly expressed by human fibroblasts and smooth muscle that may contribute to the supporting properties of fibroblasts to hESC culture (Gremlin and MMP1), one hematopoietic marker (CD45), one central nervous system specific gene (GFAP) and one ubiquitously expressed gene (Ribosomal protein L3 (RPL3))(A). FZD7 expression in three distinct datasets using the Amazonia! web tool: in the “Embryonic and adult normal tissues” series (Affymetrix U133A microarray, from 8 different publications) (B), in the “hESC” series from Enver et al. (Affymetrix U133A) [56] (C) and in the “hESC, germinal and embryonic malignancies” series (Standford microarray) [29]. EC: embryonic carcinoma; YSC: Yolk sac carcinoma. (D) Comparison of the expression of CD24 mRNA across normal (NL) and malignant lung (ML) samples (E), and across normal hematopoietic (NH) and B acute lymphoblastic leukemia (ALL) and T ALL samples (F).

References

    1. Evans MJ, Kaufman MH. Establishment in culture of pluripotential cells from mouse embryos. Nature. 1981;292:154–156. - PubMed
    1. Thomson JA, Itskovitz-Eldor J, Shapiro SS, et al. Embryonic stem cell lines derived from human blastocysts. Science. 1998;282:1145–1147. - PubMed
    1. Chambers I, Colby D, Robertson M, et al. Functional expression cloning of Nanog, a pluripotency sustaining factor in embryonic stem cells. Cell. 2003 Jun 30;113:643–655. - PubMed
    1. Nichols J, Zevnik B, Anastassiadis K, et al. Formation of pluripotent stem cells in the mammalian embryo depends on the POU transcription factor Oct4. Cell. 1998 Nov 30;95:379–391. - PubMed
    1. Hanna LA, Foreman RK, Tarasenko IA, Kessler DS, Labosky PA. Requirement for Foxd3 in maintaining pluripotent cells of the early mouse embryo. Genes Dev. 2002 Nov 15;16:2650–2661. - PMC - PubMed

Publication types