

Rapid dissemination of Plasmodium falciparum drug resistance despite strictly controlled antimalarial use
- PMID: 17206274
- PMCID: PMC1764034
- DOI: 10.1371/journal.pone.0000139
Rapid dissemination of Plasmodium falciparum drug resistance despite strictly controlled antimalarial use
Abstract
Background: Inadequate treatment practices with antimalarials are considered major contributors to Plasmodium falciparum resistance to chloroquine, pyrimethamine and sulfadoxine. The longitudinal survey conducted in Dielmo, a rural Senegalese community, offers a unique frame to explore the impact of strictly controlled and quantified antimalarial use for diagnosed malaria on drug resistance.
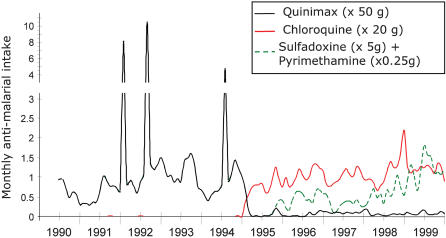
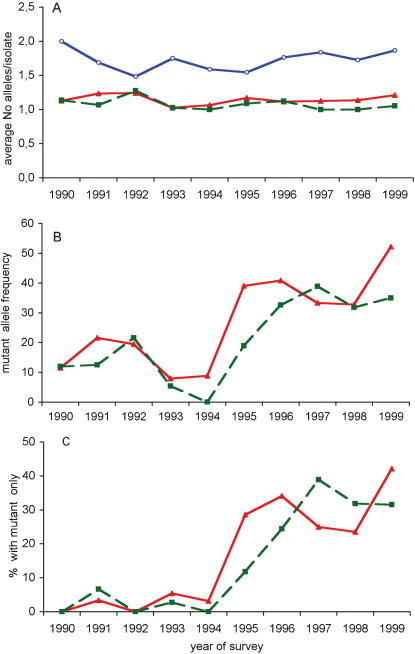
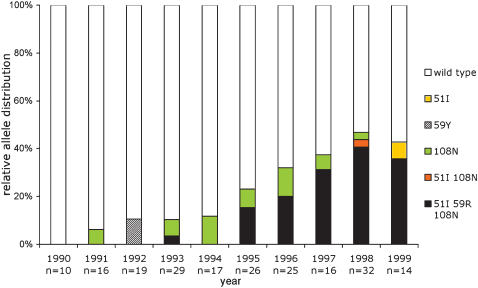
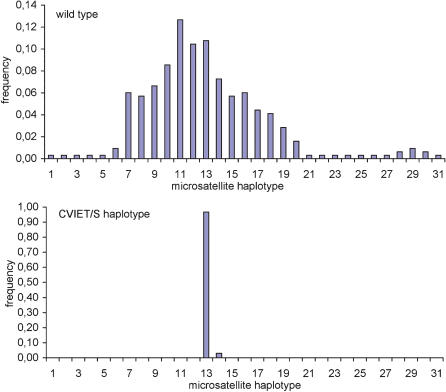
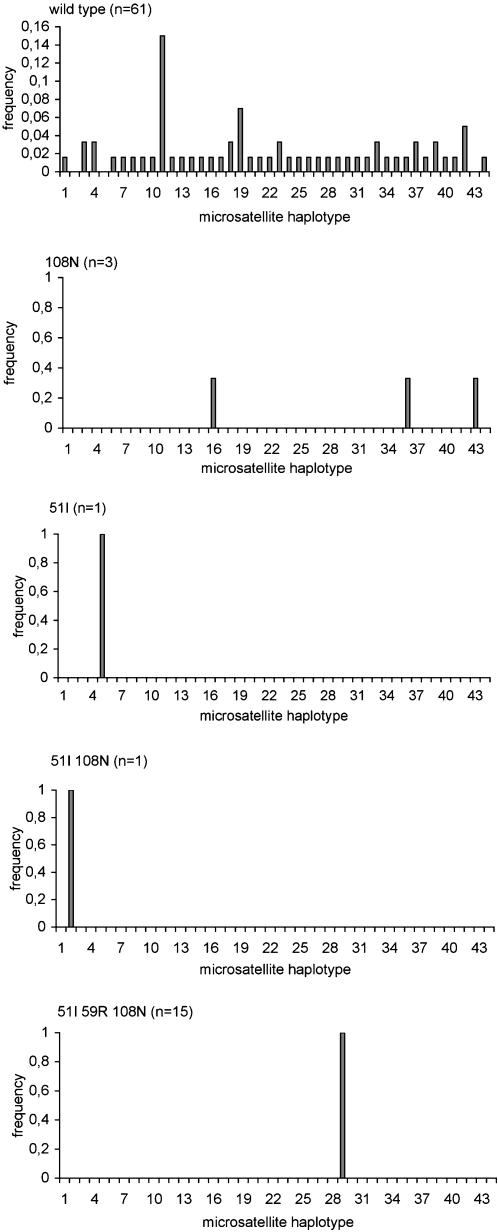
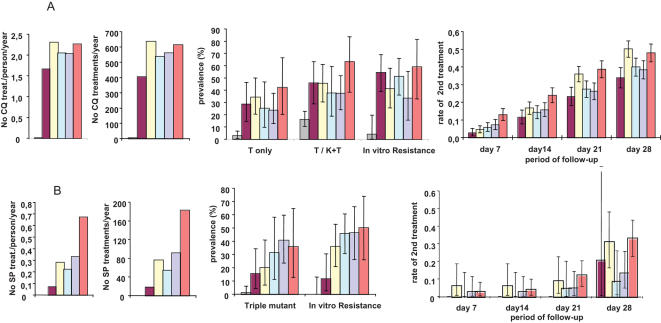
Methodology/principal findings: We conducted on a yearly basis a retrospective survey over a ten-year period that included two successive treatment policies, namely quinine during 1990-1994, and chloroquine (CQ) and sulfadoxine/pyrimethamine (SP) as first and second line treatments, respectively, during 1995-1999. Molecular beacon-based genotyping, gene sequencing and microsatellite analysis showed a low prevalence of Pfcrt and Pfdhfr-ts resistance alleles of Southeast Asian origin by the end of 1994 and their effective dissemination within one year of CQ and SP implementation. The Pfcrt resistant allele rose from 9% to 46% prevalence during the first year of CQ reintroduction, i.e., after a mean of 1.66 CQ treatment courses/person/year. The Pfdhfr-ts triple mutant rose from 0% to 20% by end 1996, after a mean of 0.35 SP treatment courses/person in a 16-month period. Both resistance alleles were observed at a younger age than all other alleles. Their spreading was associated with enhanced in vitro resistance and rapidly translated in an increased incidence of clinical malaria episodes during the early post-treatment period.
Conclusion/significance: In such a highly endemic setting, selection of drug-resistant parasites took a single year after drug implementation, resulting in a rapid progression of the incidence of clinical malaria during the early post-treatment period. Controlled antimalarial use at the community level did not prevent dissemination of resistance haplotypes. This data pleads against reintroduction of CQ in places where resistant allele frequency has dropped to a very low level after CQ use has been discontinued, unless drastic measures are put in place to prevent selection and spreading of mutants during the post-treatment period.
Conflict of interest statement
Figures
Similar articles
-
Molecular surveillance of Plasmodium falciparum drug resistance markers reveals partial recovery of chloroquine susceptibility but sustained sulfadoxine-pyrimethamine resistance at two sites of different malaria transmission intensities in Rwanda.Acta Trop. 2016 Dec;164:329-336. doi: 10.1016/j.actatropica.2016.09.008. Epub 2016 Sep 17. Acta Trop. 2016. PMID: 27647575 Free PMC article.
-
Prevalence of Plasmodium falciparum Molecular Markers of Antimalarial Drug Resistance in a Residual Malaria Focus Area in Sabah, Malaysia.PLoS One. 2016 Oct 27;11(10):e0165515. doi: 10.1371/journal.pone.0165515. eCollection 2016. PLoS One. 2016. PMID: 27788228 Free PMC article.
-
Molecular markers associated with resistance to commonly used antimalarial drugs among Plasmodium falciparum isolates from a malaria-endemic area in Taiz governorate-Yemen during the transmission season.Acta Trop. 2016 Oct;162:174-179. doi: 10.1016/j.actatropica.2016.06.016. Epub 2016 Jun 22. Acta Trop. 2016. PMID: 27343362
-
Pyrimethamine-sulfadoxine resistance in Plasmodium falciparum: what next?Trends Parasitol. 2001 Dec;17(12):582-8. doi: 10.1016/s1471-4922(01)02085-2. Trends Parasitol. 2001. PMID: 11756042 Review.
-
Population biology and antimalarial resistance: The transmission of antimalarial drug resistance in Plasmodium falciparum.Acta Trop. 2005 Jun;94(3):230-40. doi: 10.1016/j.actatropica.2005.04.014. Acta Trop. 2005. PMID: 15878154 Review.
Cited by
-
Drug coverage in treatment of malaria and the consequences for resistance evolution--evidence from the use of sulphadoxine/pyrimethamine.Malar J. 2010 Jul 5;9:190. doi: 10.1186/1475-2875-9-190. Malar J. 2010. PMID: 20602754 Free PMC article.
-
World Antimalarial Resistance Network (WARN) II: in vitro antimalarial drug susceptibility.Malar J. 2007 Sep 6;6:120. doi: 10.1186/1475-2875-6-120. Malar J. 2007. PMID: 17822533 Free PMC article.
-
Multinormal in vitro distribution model suitable for the distribution of Plasmodium falciparum chemosusceptibility to doxycycline.Antimicrob Agents Chemother. 2009 Feb;53(2):688-95. doi: 10.1128/AAC.00546-08. Epub 2008 Dec 1. Antimicrob Agents Chemother. 2009. PMID: 19047651 Free PMC article.
-
Human-to-mosquito transmission efficiency increases as malaria is controlled.Nat Commun. 2015 Jan 19;6:6054. doi: 10.1038/ncomms7054. Nat Commun. 2015. PMID: 25597498 Free PMC article.
-
Inflammatory cytokine and humoral responses to Plasmodium falciparum glycosylphosphatidylinositols correlates with malaria immunity and pathogenesis.Immun Inflamm Dis. 2015 Nov 6;4(1):24-34. doi: 10.1002/iid3.89. eCollection 2016 Mar. Immun Inflamm Dis. 2015. PMID: 27042299 Free PMC article.
References
-
- Trape JF. The public health impact of chloroquine resistance in Africa. Am J Trop Med Hyg. 2001;64:12–17. - PubMed
-
- Wootton JC, Feng X, Ferdig MT, Cooper RA, Mu J, et al. Genetic diversity and chloroquine selective sweeps in Plasmodium falciparum. Nature. 2002;418:320–323. - PubMed
-
- Cortese JF, Caraballo A, Contreras CE, Plowe CV. Origin and dissemination of Plasmodium falciparum drug-resistance mutations in South America. J Infect Dis. 2002;186:999–1006. - PubMed
-
- Roper C, Pearce R, Bredenkamp B, Gumede J, Drakeley C, et al. Antifolate antimalarial resistance in southeast Africa: a population-based analysis. Lancet. 2003;361:1174–1181. - PubMed
Publication types
MeSH terms
Substances
LinkOut - more resources
Full Text Sources
Other Literature Sources
