. 2007 Jan 3;2(1):e140.
doi: 10.1371/journal.pone.0000140.

Improvements to the Red List Index

Affiliations

Improvements to the Red List Index

Stuart H M Butchart et al. PLoS One. .

Abstract

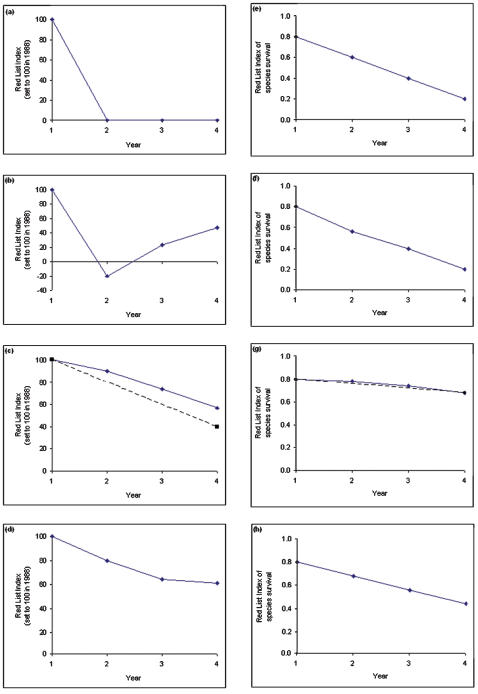
The Red List Index uses information from the IUCN Red List to track trends in the projected overall extinction risk of sets of species. It has been widely recognised as an important component of the suite of indicators needed to measure progress towards the international target of significantly reducing the rate of biodiversity loss by 2010. However, further application of the RLI (to non-avian taxa in particular) has revealed some shortcomings in the original formula and approach: It performs inappropriately when a value of zero is reached; RLI values are affected by the frequency of assessments; and newly evaluated species may introduce bias. Here we propose a revision to the formula, and recommend how it should be applied in order to overcome these shortcomings. Two additional advantages of the revisions are that assessment errors are not propagated through time, and the overall level extinction risk can be determined as well as trends in this over time.


Conflict of interest statement

Competing Interests: The authors have declared that no competing interests exist.

Figures

Figure 1
Figure 1
RLIs using the original formulation (left-hand graphs) and the revised formulation (right-hand graphs) for three hypothetical examples: (A and E) a set of five species, which are all classified as Near Threatened in year 1, Vulnerable in year 2, Endangered in year 3, and Critically Endangered in year 4; (B and F) the same scenario, except that one species jumps from Near Threatened to Vulnerable by year 2; (C and G) a set of ten Near Threatened species in year 1, with one species moving into Vulnerable in each subsequent year, and then up through the categories one step at a time each year thereafter; the dotted line shows the RLI as would be calculated if the same set of species were assessed for the IUCN Red List in years 1 and 4 only; (D and H) ten Near Threatened species that deteriorate by 0.1 category per species per year (i.e. one species per year moves up a category), plus ten Near Threatened species that deteriorate at ten times this rate (i.e. all ten species per year move up a category) and that are not assessed until year 3.
Figure 2
Figure 2
RLI using (A) the original formulation; and (B) the new formulation for the same hypothetical set of 10 species as in Figure 1c and g. The dotted line represents the RLI that would be calculated if five Near Threatened species had been misclassified as Vulnerable in year 1 owing to poor knowledge, and if this error was not corrected until year 4. The original formulation produces an RLI that is substantially lower in value than reality because it propagates errors resulting from incomplete knowledge in earlier assessments. The new formulation does not suffer from this effect.
Figure 3
Figure 3
RLIs using the original formulation (left-hand graphs) and the revised formulation (right-hand graphs) for (A–B) the world's birds (n = 9,824 non-Data Deficient species: 99.2% of all extant species) and (C–D) birds in different biogeographic realms. Under the revised formula, an RLI value of 1.0 equates to all species being categorised as Least Concern, and hence that none are expected to go extinct in the near future; an RLI value of zero indicates that all species have gone Extinct. In Figure 3A, the dotted line represents the RLI using the same original formula, but incorporating back-casting using the latest and best-informed evaluations. It results in a substantially higher value by 2004 because the original approach propagates errors resulting from incomplete knowledge in earlier assessments. By 2004, the difference is comparable to the size of the error bars calculated from estimates of the magnitude of the error introduced by delays in knowledge becoming available to assessors .

References

    1. Secretariat of the Convention on Biological Diversity. Handbook of the Convention on Biological Diversity. London: Earthscan; 2003.
    1. Mace GM. An index of intactness. Nature. 2005;434:32–33. - PubMed
    1. Pereira HM, Cooper HD. Towards the global monitoring of biodiversity change. Trends in Ecology & Evolution. 2006;21:123–129. - PubMed
    1. Butchart SHM, Stattersfield AJ, Bennun LA, Shutes SM, Akçakaya HR, et al. Measuring global trends in the status of biodiversity: Red List Indices for birds. PLoS Biology. 2004;2:e383. - PMC - PubMed
    1. Lamoreux J, Akcakaya HR, Bennun L, Collar NJ, Boitani L, et al. Value of the IUCN Red List. Trends in Ecology & Evolution. 2003;18:214–215.