Meta-Analysis
. 2007 Jan 3;2(1):e145.
doi: 10.1371/journal.pone.0000145.

Heterologous tissue culture expression signature predicts human breast cancer prognosis

Affiliations
Meta-Analysis

Heterologous tissue culture expression signature predicts human breast cancer prognosis

Eun Sung Park et al. PLoS One. .

Abstract

Background: Cancer patients have highly variable clinical outcomes owing to many factors, among which are genes that determine the likelihood of invasion and metastasis. This predisposition can be reflected in the gene expression pattern of the primary tumor, which may predict outcomes and guide the choice of treatment better than other clinical predictors.

Methodology/principal findings: We developed an mRNA expression-based model that can predict prognosis/outcomes of human breast cancer patients regardless of microarray platform and patient group. Our model was developed using genes differentially expressed in mouse plasma cell tumors growing in vivo versus those growing in vitro. The prediction system was validated using published data from three cohorts of patients for whom microarray and clinical data had been compiled. The model stratified patients into four independent survival groups (BEST, GOOD, BAD, and WORST: log-rank test p = 1.7x10(-8)).

Conclusions: Our model significantly improved the survival prediction over other expression-based models and permitted recognition of patients with different prognoses within the estrogen receptor-positive group and within a single pathological tumor class. Basing our predictor on a dataset that originated in a different species and a different cell type may have rendered it less sensitive to proliferation differences and endowed it with wide applicability.

Significance: Prognosis prediction for patients with breast cancer is currently based on histopathological typing and estrogen receptor positivity. Yet both assays define groups that are heterogeneous in survival. Gene expression profiling allows subdivision of these groups and recognition of patients whose tumors are very unlikely to be lethal and those with much grimmer outlooks, which can augment the predictive power of conventional tumor analysis and aid the clinician in choosing relaxed vs. aggressive therapy.


Conflict of interest statement

Competing Interests: The authors have declared that no competing interests exist.

Figures

Figure 1
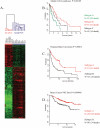
Figure 1. Mouse plasma cell tumor tissue culture (PCT-TC) signature and survival analysis of human cancer patients
27 RNA samples from 17 solid mouse plasma cell tumors and 10 tissue cultured mouse PCT-TC cell lines (including Baf3, a pre-B cell line) were used for the generation of PCT-TC signature. A. Mouse plasma cell tumor tissue culture signature. 1162 genes showing significant differences in expression between solid PCTs and tissue-cultured PCTs were selected by SAM analysis at the 99-percentile confidence level with a 0.001 FDR. B–D. Kaplan-Meier survival analysis of human cancer patients groups generated by unsupervised cluster analysis with mouse PCT-TC signature. B. Survival analysis of human mantle cell lymphoma patients group generated by unsupervised cluster analysis with 694 orthologs of the mouse PCT-TC signature genes. C. Survival analysis of human liver cancer patients generated by unsupervised cluster analysis with 971 orthologs of the mouse PCT-TC signature genes. D. Survival analysis of human breast cancer patients , , generated by unsupervised cluster analysis with 470 orthologs of the mouse PCT-TC signature genes.
Figure 2
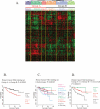
Figure 2. Construction of human breast cancer patients' prognosis prediction models and evaluation of outcomes
A. Unsupervised cluster analysis of NKI training data set (147 samples). It generated two main clusters and six sub-clusters of patients. B. Kaplan-Meier survival analysis of the two main clusters (Group A and Group B). C. Kaplan-Meier survival analysis of the six subclusters (Group A1–A3 and Group B1–B3). D. Kaplan-Meier survival analysis of two sub-clusters (Group A2 and Group B1) showing WORST and BEST prognosis and one group that includes all the others.
Figure 3
Figure 3. Overview of strategy for the construction of prediction models and evaluation of outcomes.
Based on the unsupervised cluster analysis results, 3 independent prediction models are generated.
Figure 4
Figure 4. Kaplan-Meier plots of overall survival with NKI validation set predicted by six different prediction algorithms in 3 independent prediction models.
A 1–6. Group B (with good prognosis) vs. the rest (Group A, with bad prognosis) (Predictor 1). B 1–6. Subgroup B1 (BEST prognosis) vs. the rest of all (predictor 2). C 1–6. Subgroup A2 (WORST prognosis) vs. the rest of all (predictor 3). The differences between groups were significant in log rank test, with p value indicated above each plot.
Figure 5
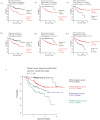
Figure 5. Defining four distinct survival subgroups of human breast cancer
A. Predicted outcomes in NKI test set (148 patients). Kaplan-Meier plot for the representative groups for 6 different prediction algorithms. If a sample was predicted to belong to the test class (black lines) 3 or more times in the 6 different prediction methods, it was assigned to that group. Otherwise that patient/sample remained in “rest of all” (red lines). There were no 3:3 ties for predictor 1. For predictors 2 and 3, ties were assigned to BEST and WORST, respectively. B. Predicted outcomes for combined NKI data sets (295 total patients). Kaplan Meier plots of overall survival of two independent groups identified with two independent analyses (unsupervised clustering in training data set and class prediction in validation set). C. Kaplan-Meier plot of four independent prognostic subtypes generated with the NKI data set. Four independent prognostic subtypes (BEST, GOOD, BAD, and WORST) are assigned as follows. Samples that fell into the Group B (good prognosis group) with predictor 1 (Good vs. Bad) but not assigned to the BEST prognosis group with predictor 2 (BEST vs. all the rest) were assigned to an intermediate group designated GOOD. Similarly, samples that did not fall into Group B (i.e., those that belonged to Group A, the bad prognosis group) with predictor 1 (Good vs. Bad) but not assigned to the WORST prognosis group in predictor 3 (WORST vs. all the rest) were assigned to an intermediate group designated BAD.
Figure 6
Figure 6. Prediction of breast cancer patients' outcomes based on a combination of gene expression and other criteria
The outcome groups previously assigned in the literature based on various criteria (ER status , , pathological tumor grade , intrinsic-sub type , and 70-gene signature [2], [3]) were reassessed and further stratified using our prediction system. A. Kaplan-Meier plot of ER-positive patients stratified by 3 independent prediction steps. Estrogen receptor-positive patients in the NKI data set were further stratified into the BEST prognosis group (69 patients, 4 deaths), GOOD prognosis group (106 patients, 23 deaths), BAD prognosis group (46 patients, 17 deaths) and WORST prognosis groups (5 patients, 1 death). B. Kaplan-Meier plots of survival analysis of ER-negative groups and 3 ER-positive groups that were further stratified by our 3-step prediction analysis. C. Kaplan-Meier plot for patients with grade II tumors after further stratification with 3 independent prediction steps. 28 patients were assigned to the BEST prognosis subtype, showing a 96% 15-year survival rate (27 out of 28 patients). The 5 patients assigned to the WORST prognosis subtype had only a 20% (1 of 5 patients) 15-year survival. D. Kaplan-Meier plot for intrinsic-sub type. Survival analysis of the complete set of NKI samples (295 patients) previously assigned 5 different breast cancer intrinsic-subtypes (Luminal A, Luminal B, ERBB2, Basal, and Normal Breast-like) by nearest centroid class prediction. E. Kaplan-Meier plot for patients with intrinsic-subtypes associated with bad prognosis (Basal, ERBB2+, and Luminal B) after further stratification with our 3-step prediction analysis. This predictor revealed 11 patients that fell into the BEST prognosis group (no deaths within 15 years). F. Kaplan-Meier plot for the cell types that could not be assigned (NA) based on correlation coefficients cutting threshold of 0.1. Samples previously not assigned (NA) to any of histological cell types were stratified using our prediction system, revealing subgroups with significantly different clinical outcomes. G. Kaplan-Meier plot for the poor prognosis group in the 70-gene-based prediction after further stratification with our 3-step prediction analysis.
Figure 7
Figure 7. Prediction of independent cohorts of human breast cancer patients
The results are shown as the summarized predicted outcomes determined from the results of 6 different prediction algorithms. A. Kaplan-Meier plots for the summarized predicted outcomes of Duke University patients . B. Kaplan-Meier plots for the summarized predicted outcomes of UNC patients . C. Kaplan-Meier plots for the combined predicted outcomes of UNC data and Duke University patients.
Figure 8
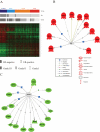
Figure 8. Genes showing significant differences in expression among independent groups (BEST, GOOD, BAD and WORST)
A. Gene clustering of 295 NKI samples using genes selected by one-way ANOVA class comparisons. A total of 3307 genes that showed significant expression differences (p<1×10⁻⁸) in a one-way ANOVA analysis were selected. ER expression status and the histo-pathological grade of each tumor sample are shown in grey-scale bars beneath the colored BEST – WORST classification bar. The key to the grey-scale designations is found beneath the heat map. B. PathwayAssistTM–generated figure showing networks of transcription factors activated by EGF and showing significantly higher expression in tumors from patients in the WORST prognosis group (indicated by red color) compared to the BEST prognosis group. C. PathwayAssistTM–generated figure showing networks of genes activated by PTGS2 (COX2) and showing significantly lower expression in tumors from patients in the WORST prognosis group (indicated by green color) compared to the BEST prognosis group.

References

    1. Kalluri R, Zeisberg M. Fibroblasts in cancer. Nature Reviews Cancer. 2006;6:392–401. - PubMed
    1. van de Vijver MJ, He YD, van't Veer LJ, Dai H, Hart AA, et al. A gene-expression signature as a predictor of survival in breast cancer. N Engl J Med. 2002;347:1999–2009. - PubMed
    1. van't Veer LJ, Dai H, van de Vijver MJ, He YD, Hart AA, et al. Gene expression profiling predicts clinical outcome of breast cancer. Nature. 2002;415:530–536. - PubMed
    1. Bild AH, Yao G, Chang JT, Wang Q, Potti A. Oncogenic pathway signatures in human cancers as a guide to targeted therapies. Nature. 2006;439:353–357. - PubMed
    1. Oh DS, Troester MA, Usary J, Hu Z, He X, et al. Estrogen-regulated genes predict survival in hormone receptor-positive breast cancers. J Clin Oncol. 2006;24:1656–1664. - PubMed

Publication types