. 2007 Mar;89(3):307-15.
doi: 10.1016/j.ygeno.2006.11.012. Epub 2007 Jan 5.

hORFeome v3.1: a resource of human open reading frames representing over 10,000 human genes

Affiliations

hORFeome v3.1: a resource of human open reading frames representing over 10,000 human genes

Philippe Lamesch et al. Genomics. 2007 Mar.

Abstract

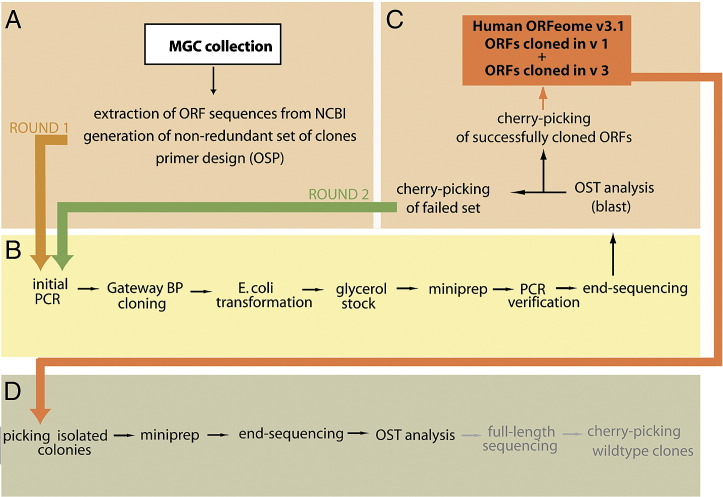
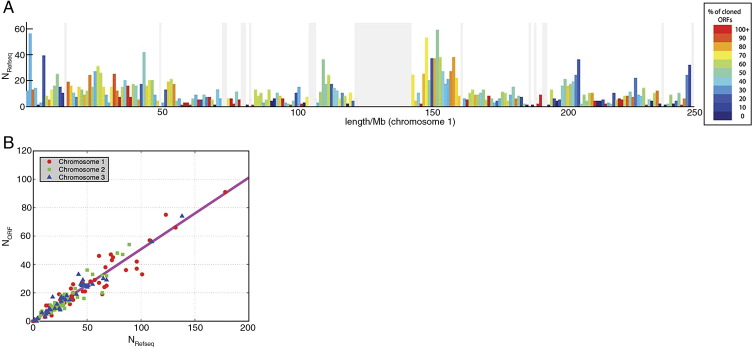
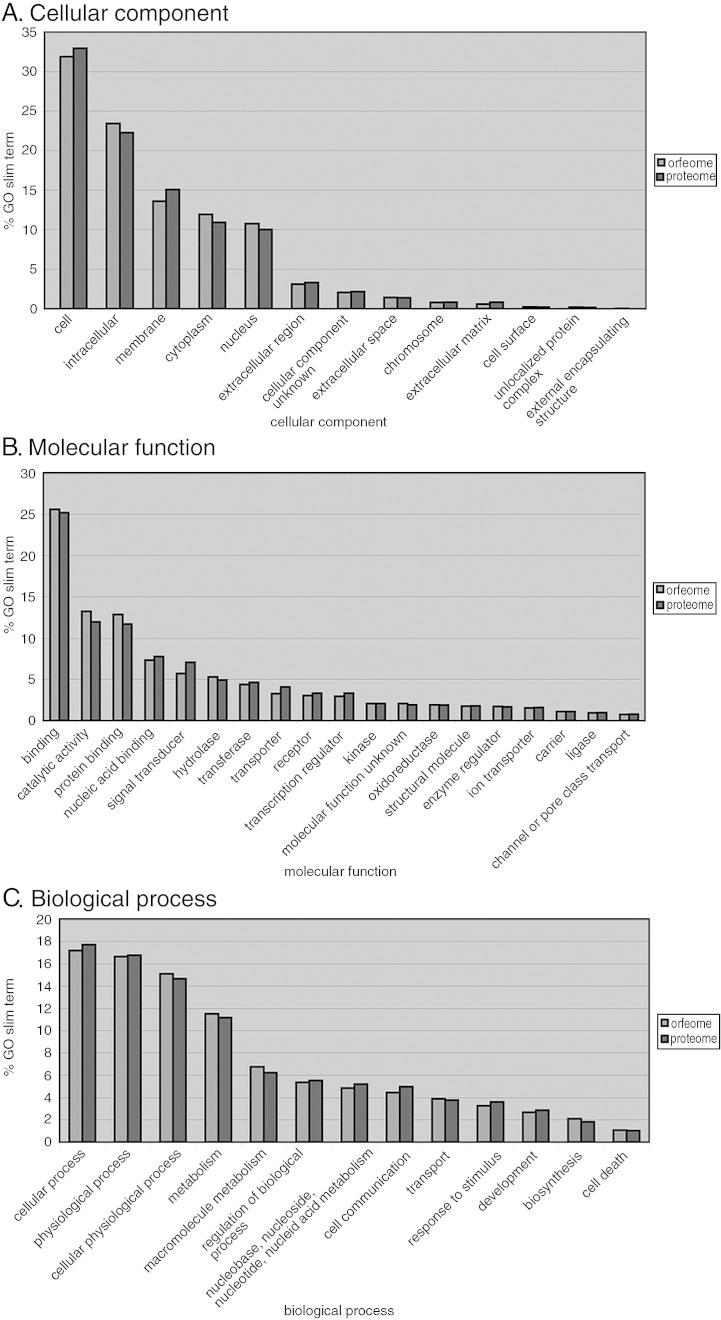
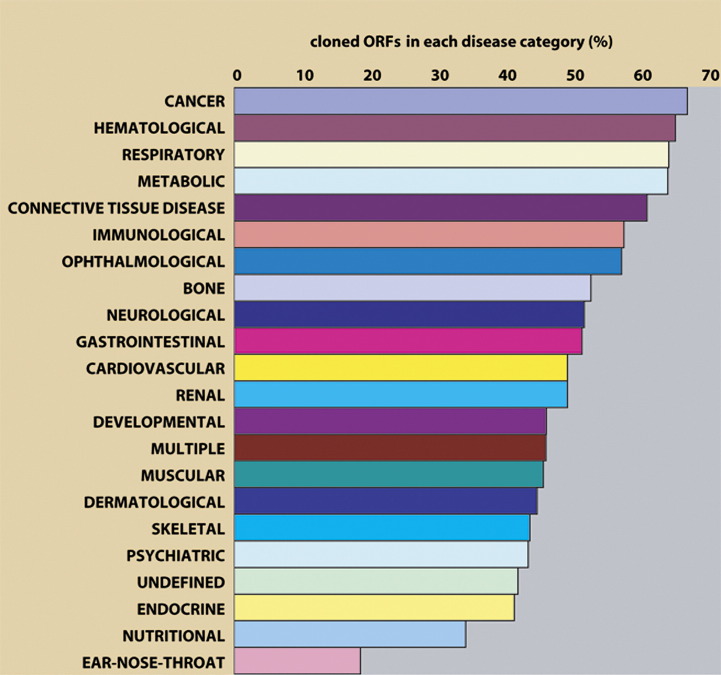
Complete sets of cloned protein-encoding open reading frames (ORFs), or ORFeomes, are essential tools for large-scale proteomics and systems biology studies. Here we describe human ORFeome version 3.1 (hORFeome v3.1), currently the largest publicly available resource of full-length human ORFs (available at ). Generated by Gateway recombinational cloning, this collection contains 12,212 ORFs, representing 10,214 human genes, and corresponds to a 51% expansion of the original hORFeome v1.1. An online human ORFeome database, hORFDB, was built and serves as the central repository for all cloned human ORFs (http://horfdb.dfci.harvard.edu). This expansion of the original ORFeome resource greatly increases the potential experimental search space for large-scale proteomics studies, which will lead to the generation of more comprehensive datasets.


Figures

Supplementary Fig. 1
Correlation between ORF size and cloning success rate. As expected, the cloning success rate decreased with increasing ORF size.
Supplementary Fig. 2
Distribution of cloned ORFs within each chromosome. See Fig. 2 in main text for details.
Supplementary Fig. 2
Distribution of cloned ORFs within each chromosome. See Fig. 2 in main text for details.
Supplementary Fig. 2
Distribution of cloned ORFs within each chromosome. See Fig. 2 in main text for details.
Supplementary Fig. 3
Comparison between the distributions of local cloning success rates and the aggregated distribution for each of the chromosomes. The red curves show the cumulative probability distribution function for the cloning success rates as measured in 1 Mb bins for each of the chromosomes, i.e., what fraction of the bins (Y axis) have smaller success rates than a specific value (X axis). Success rate was measured as the ratio of the number of cloned ORFs to that of RefSeq sequences in a given bin, as described in the text. While the success rate may occasionally be greater than 1 (there were more ORFs cloned than there were RefSeq models in a bin), these events are very rare and thus we only show success rates between 0 and 1. The identical blue curves serve as reference in each plot, and correspond to the cumulative probability distribution function of the local cloning success rates if {all} chromosomes are taken into account in calculating the statistics. Additional explanation:Table 2 shows that on most of the chromosomes the number of cloned ORFs is 42% to 53% of the total number of RefSeq sequences identified on the respective chromosome (except for chromosome 21). While this suggests that cloning of ORFs is carried out with a nearly uniform success rate for every chromosome, there may be loci on chromosomes where ORFs are under-or overrepresented. To check this, we performed a Kolmogorov-Smirnov goodness-of-fit test for each of the chromosomes: the test decides if the local cloning success rates of a chromosome may come from the reference distribution at a specified level of significance. For the reference distribution, we chose the distribution of local cloning success rates in 1 Mb bins, taking {every} chromosome into account. Calculating the largest absolute difference between the reference cumulative distribution and the cumulative distributions determined for each chromosome as required by the test (Supplementary figure 3), we found that the distributions for chromosomes 19, 20, 21, X, and Y were different from the overall distribution at the 0.05 significance level.
Supplementary Fig. 4
VisANT vizualisation tool showing a protein-protein interaction sub-network. This figure shows a screen-shot of VisANT displaying a 2nd-level interaction network for human actinin alpha 4 (highlighted with red dots) containing three first-level interactors (proteins that interact directly with actinin) and six second-level interactors (proteins that interact with the interaction partners of actinin). The user can expand the visible network by clicking on each node of interest, thereby revealing the next level of interactors. Each protein in the network contains links back to its corresponding hORFeome v3.1 webpage, as well as to its corresponding pages on the NCBI EntrezGene, NCBI Nucleotide and KEGG websites.
Fig. 1
Fig. 1
Automated human ORFeome pipeline. (A) A filter computationally removed ORFs, extracted from MGC cDNAs, that were not full-length; short ORFs (< 100 nucleotides); and redundantly cloned ORFs. Isoforms and SNP variants of each gene were retained and treated as individual clones. (B) Clones were PCR amplified, Gateway cloned, and sequenced at the 5′ end using universal primers. (C) The resulting ORF sequence tags (OSTs) were aligned to the ORFeome database containing all attempted ORF sequences. Clone attempts that produced a PCR band but whose 5′ OST did not correspond to the expected cDNA underwent a second round of cloning. Successfully cloned ORFs from hORFeome v1 and v3 were combined to form hORFeome v3.1. (D) To investigate the quality of this resource, we picked isolated colonies for 564 ORFs and sequenced them at their 5′ and 3′ ends. In the upcoming ORFeome version 4 project, clones without mutations in their end sequences will undergo full-length sequencing to generate a resource of wild-type clones for each ORF in the hORFeome v3.1.
Fig. 2
Fig. 2
Distribution of cloned ORFs within each chromosome. (A) To determine whether chromosomes contain regions that are under- or overrepresented in the ORFeome, we divided each chromosome into 1-Mb bins and counted the number of cloned ORFs and the number of RefSeq sequences in each bin. The x axis represents the length (Mb) of chromosome I and the y axis the number of RefSeq sequences in each bin. The colors of the bars reflect the percentage of RefSeqs in each bin that were cloned in the ORFeome, as indicated by the color key. If the cloning success rate was uniformly independent of the position on the chromosome, every bar should be colored the same. Gray lines correspond to bins without RefSeq models and the wide gray vertical region in the middle of the chromosome corresponds to the centromere (Supplementary Fig. 2 shows graphs of the remaining chromosomes). (B) The number of cloned ORFs in bins 1 Mb in length, NORF, shown as a function of the number of predictions in the same respective bins, NRefSeq. Three chromosomes were taken as examples in this graph (chromosomes 1, 2, and 3). The straight line represents the linear regression to the data points. While only three of the chromosomes have been shown for clarity, the fitting yields NORF = (0.49 ± 0.006)NRefSeq + (0.42 ± 0.32) if all chromosomes are taken into account, predicting an overall cloning success rate of about 49% for every chromosomal bin.
Fig. 3
Fig. 3
Classification of cloned ORFs by GO Slim terms. To identify over- or underrepresented functional categories of proteins in the ORFeome, we classified ORFs by GO Slim terms within their three GO branches, (A) cellular component, (B) molecular function, and (C) biological process, and compared the fraction of each GO Slim term found in the ORFeome to that of the entire proteome. No GO Slim term in any of the three branches is over- or underrepresented in the ORFeome.
Fig. 4
Fig. 4
Representation of disease genes in hORFeome v3.1. The list of inherited diseases and their associated genes was retrieved from the OMIM database, and the diseases were grouped into 22 disease categories based on the physiological system affected. The length of each bar represents the percentage of diseases in each disease category for which we cloned at least one associated ORF.

Similar articles

Cited by

References

    1. Adams M.D. The genome sequence of Drosophila melanogaster. Science. 2000;287:2185–2195. - PubMed
    1. Gibbs R.A. Genome sequence of the Brown Norway rat yields insights into mammalian evolution. Nature. 2004;428:493–521. - PubMed
    1. A. Goffeau, et al., Life with 6000 genes, Science 274 (1996) 546, 563–567. - PubMed
    1. Lander E.S. Initial sequencing and analysis of the human genome. Nature. 2001;409:860–921. - PubMed
    1. Venter J.C. The sequence of the human genome. Science. 2001;291:1304–1351. - PubMed

Publication types

Substances

LinkOut - more resources