

Separate coding of different gaze directions in the superior temporal sulcus and inferior parietal lobule
- PMID: 17208181
- PMCID: PMC1885952
- DOI: 10.1016/j.cub.2006.10.052
Separate coding of different gaze directions in the superior temporal sulcus and inferior parietal lobule
Abstract
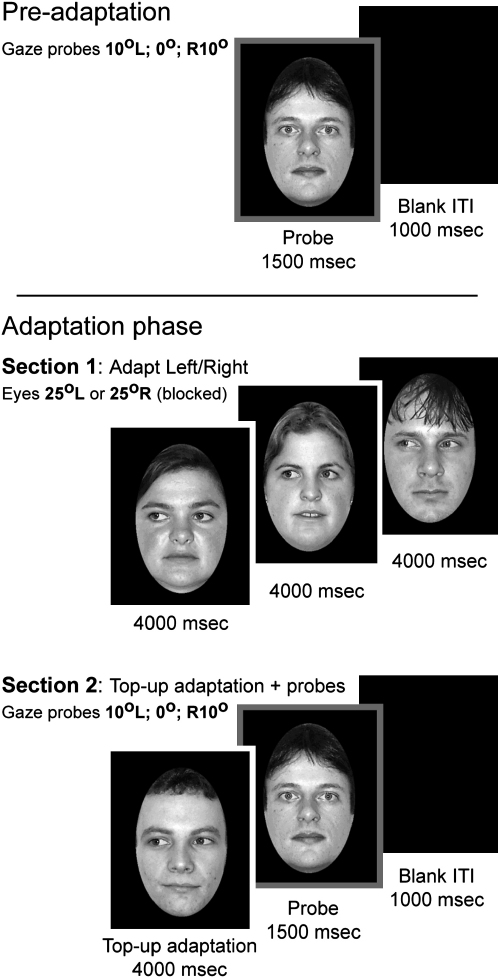
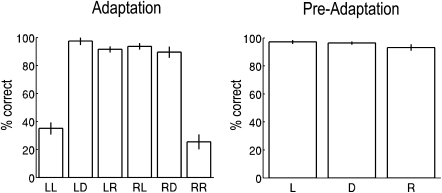
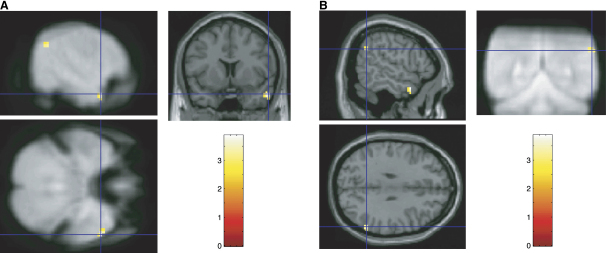
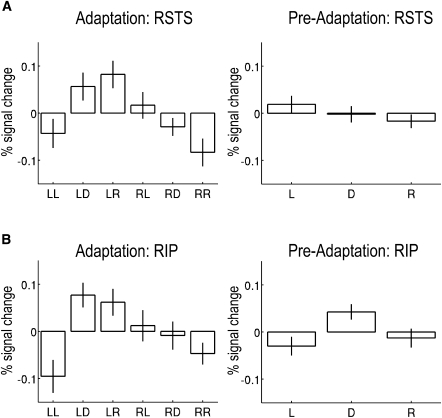
Electrophysiological recording in the anterior superior temporal sulcus (STS) of monkeys has demonstrated separate cell populations responsive to direct and averted gaze. Human functional imaging has demonstrated posterior STS activation in gaze processing, particularly in coding the intentions conveyed by gaze, but to date has provided no evidence of dissociable coding of different gaze directions. Because the spatial resolution typical of group-based fMRI studies (approximately 6-10 mm) exceeds the size of cellular patches sensitive to different facial characteristics (1-4 mm in monkeys), a more sensitive technique may be required. We therefore used fMRI adaptation, which is considered to offer superior resolution, to investigate whether the human anterior STS contains representations of different gaze directions, as suggested by non-human primate research. Subjects viewed probe faces gazing left, directly ahead, or right. Adapting to leftward gaze produced a reduction in BOLD response to left relative to right (and direct) gaze probes in the anterior STS and inferior parietal cortex; rightward gaze adaptation produced a corresponding reduction to right gaze probes. Consistent with these findings, averted gaze in the adapted direction was misidentified as direct. Our study provides the first human evidence of dissociable neural systems for left and right gaze.
Figures
Comment in
-
Visual neuroscience: face-encoding mechanisms revealed by adaptation.Curr Biol. 2007 Jan 9;17(1):R20-2. doi: 10.1016/j.cub.2006.11.038. Curr Biol. 2007. PMID: 17208172
Similar articles
-
Facial expression and gaze-direction in human superior temporal sulcus.Neuropsychologia. 2007 Nov 5;45(14):3234-41. doi: 10.1016/j.neuropsychologia.2007.06.022. Epub 2007 Jul 5. Neuropsychologia. 2007. PMID: 17707444
-
A head view-invariant representation of gaze direction in anterior superior temporal sulcus.Curr Biol. 2011 Nov 8;21(21):1817-21. doi: 10.1016/j.cub.2011.09.025. Epub 2011 Oct 27. Curr Biol. 2011. PMID: 22036180 Free PMC article.
-
When strangers pass: processing of mutual and averted social gaze in the superior temporal sulcus.Psychol Sci. 2004 Sep;15(9):598-603. doi: 10.1111/j.0956-7976.2004.00726.x. Psychol Sci. 2004. PMID: 15327630
-
[The role of the superior temporal sulcus in face recognition and perception].Brain Nerve. 2012 Jul;64(7):737-42. Brain Nerve. 2012. PMID: 22764345 Review. Japanese.
-
Superior temporal sulcus--It's my area: or is it?J Cogn Neurosci. 2008 Dec;20(12):2125-36. doi: 10.1162/jocn.2008.20148. J Cogn Neurosci. 2008. PMID: 18457502 Review.
Cited by
-
Predicting others' actions via grasp and gaze: evidence for distinct brain networks.Psychol Res. 2012 Jul;76(4):494-502. doi: 10.1007/s00426-011-0393-9. Epub 2011 Nov 27. Psychol Res. 2012. PMID: 22120203
-
Cognitive dysfunctions in high myopia: An overview of potential neural morpho-functional mechanisms.Front Neurol. 2022 Nov 3;13:1022944. doi: 10.3389/fneur.2022.1022944. eCollection 2022. Front Neurol. 2022. PMID: 36408499 Free PMC article. Review.
-
Adaptation to the Direction of Others' Gaze: A Review.Front Psychol. 2018 Nov 9;9:2165. doi: 10.3389/fpsyg.2018.02165. eCollection 2018. Front Psychol. 2018. PMID: 30473675 Free PMC article. Review.
-
Graded representations of emotional expressions in the left superior temporal sulcus.Front Syst Neurosci. 2010 Mar 15;4:6. doi: 10.3389/fnsys.2010.00006. eCollection 2010. Front Syst Neurosci. 2010. PMID: 20305753 Free PMC article.
-
"Stay tuned": inter-individual neural synchronization during mutual gaze and joint attention.Front Integr Neurosci. 2010 Nov 5;4:127. doi: 10.3389/fnint.2010.00127. eCollection 2010. Front Integr Neurosci. 2010. PMID: 21119770 Free PMC article.
References
-
- Perrett D.I., Smith P.A.J., Potter D.D., Mistlin A.J., Head A.S., Milner A.D., Jeeves M.A. Visual cells in the temporal cortex sensitive to face view and gaze direction. Proc. R. Soc. Lond. B. Biol. Sci. 1985;B223:293–317. - PubMed
-
- Perrett D.I., Hietanen J.K., Oram M.W., Benson P.J. Organization and functions of cells responsive to faces in the temporal cortex. Philos. Trans. R. Soc. Lond. B Biol. Sci. 1992;B335:23–30. - PubMed
-
- Hoffman E.A., Haxby J.V. Distinct representations of eye gaze and identity in the distributed human neural system for face perception. Nat. Neurosci. 2000;3:80–84. - PubMed
-
- Pelphrey K.A., Morris J.P., McCarthy G. Neural basis of eye gaze processing deficits in autism. Brain. 2005;128:1038–1048. - PubMed
Publication types
MeSH terms
Grants and funding
LinkOut - more resources
Full Text Sources
