

Mesoscale simulation of blood flow in small vessels
- PMID: 17208982
- PMCID: PMC1861774
- DOI: 10.1529/biophysj.106.095042
Mesoscale simulation of blood flow in small vessels
Abstract
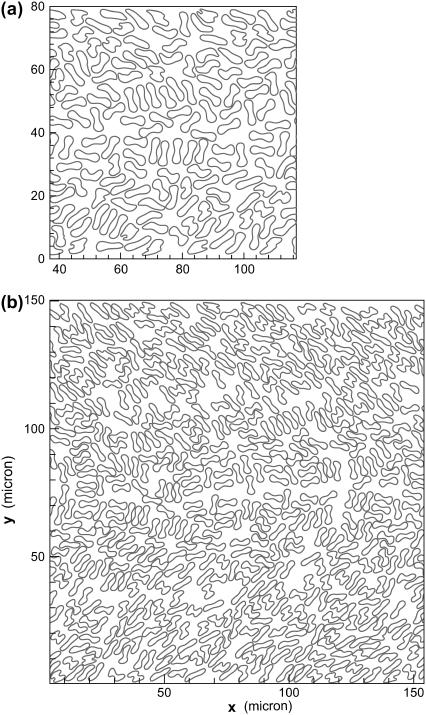
Computational modeling of blood flow in microvessels with internal diameter 20-500 microm is a major challenge. It is because blood in such vessels behaves as a multiphase suspension of deformable particles. A continuum model of blood is not adequate if the motion of individual red blood cells in the suspension is of interest. At the same time, multiple cells, often a few thousands in number, must also be considered to account for cell-cell hydrodynamic interaction. Moreover, the red blood cells (RBCs) are highly deformable. Deformation of the cells must also be considered in the model, as it is a major determinant of many physiologically significant phenomena, such as formation of a cell-free layer, and the Fahraeus-Lindqvist effect. In this article, we present two-dimensional computational simulation of blood flow in vessels of size 20-300 microm at discharge hematocrit of 10-60%, taking into consideration the particulate nature of blood and cell deformation. The numerical model is based on the immersed boundary method, and the red blood cells are modeled as liquid capsules. A large RBC population comprising of as many as 2500 cells are simulated. Migration of the cells normal to the wall of the vessel and the formation of the cell-free layer are studied. Results on the trajectory and velocity traces of the RBCs, and their fluctuations are presented. Also presented are the results on the plug-flow velocity profile of blood, the apparent viscosity, and the Fahraeus-Lindqvist effect. The numerical results also allow us to investigate the variation of apparent blood viscosity along the cross-section of a vessel. The computational results are compared with the experimental results. To the best of our knowledge, this article presents the first simulation to simultaneously consider a large ensemble of red blood cells and the cell deformation.
Figures


Similar articles
-
Microvascular blood flow resistance: Role of red blood cell migration and dispersion.Microvasc Res. 2015 May;99:57-66. doi: 10.1016/j.mvr.2015.02.006. Epub 2015 Feb 25. Microvasc Res. 2015. PMID: 25724979
-
Three-dimensional computational modeling of multiple deformable cells flowing in microvessels.Phys Rev E Stat Nonlin Soft Matter Phys. 2009 Apr;79(4 Pt 2):046318. doi: 10.1103/PhysRevE.79.046318. Epub 2009 Apr 21. Phys Rev E Stat Nonlin Soft Matter Phys. 2009. PMID: 19518344
-
A High-Fidelity Computational Model for Predicting Blood Cell Trafficking and 3D Capillary Hemodynamics in Retinal Microvascular Networks.Invest Ophthalmol Vis Sci. 2024 Nov 4;65(13):37. doi: 10.1167/iovs.65.13.37. Invest Ophthalmol Vis Sci. 2024. PMID: 39546289 Free PMC article.
-
Blood flow structure related to red cell flow: determinant of blood fluidity in narrow microvessels.Jpn J Physiol. 2001 Feb;51(1):19-30. doi: 10.2170/jjphysiol.51.19. Jpn J Physiol. 2001. PMID: 11281993 Review.
-
Red blood cell flow in the cardiovascular system: a fluid dynamics perspective.Crit Rev Biomed Eng. 2012;40(5):427-40. doi: 10.1615/critrevbiomedeng.v40.i5.30. Crit Rev Biomed Eng. 2012. PMID: 23339650 Review.
Cited by
-
Electrodeformation of Vesicles Suspended in a Liquid Medium.Phys Rev Fluids. 2018 Oct;3(10):103702. doi: 10.1103/physrevfluids.3.103702. Epub 2018 Oct 24. Phys Rev Fluids. 2018. PMID: 32864538 Free PMC article.
-
Shape transformations of red blood cells in the capillary and their possible connections to oxygen transportation.J Biol Phys. 2022 Mar;48(1):79-92. doi: 10.1007/s10867-021-09594-5. Epub 2021 Nov 19. J Biol Phys. 2022. PMID: 34799817 Free PMC article.
-
A numerical study of blood flow using mixture theory.Int J Eng Sci. 2014 Mar 1;76:56-72. doi: 10.1016/j.ijengsci.2013.12.001. Int J Eng Sci. 2014. PMID: 24791016 Free PMC article.
-
A micro-scale simulation of red blood cell passage through symmetric and asymmetric bifurcated vessels.Sci Rep. 2016 Feb 2;6:20262. doi: 10.1038/srep20262. Sci Rep. 2016. PMID: 26830454 Free PMC article.
-
Dynamics of pulsatile flow in fractal models of vascular branching networks.Med Biol Eng Comput. 2009 Jul;47(7):763-72. doi: 10.1007/s11517-009-0492-6. Epub 2009 May 26. Med Biol Eng Comput. 2009. PMID: 19468774
References
-
- Bishop, J. J., P. Nance, A. S. Popel, M. Intaglietta, and P. C. Johnson. 2001. Effect of erythrocyte aggregation on velocity profiles in venules. Am. J. Physiol. 280:H222–H236. - PubMed
-
- Bishop, J. J., A. S. Popel, M. Intaglietta, and P. C. Johnson. 2002. Effect of aggregation and shear rate on the dispersion of red blood cells flowing in venules. Am. J. Physiol. 283:H1985–H1996. - PubMed
-
- Pries, A. R., D. Neuhaus, and P. Gaehtgens. 1992. Blood viscosity in tube flow: dependence on diameter. Am. J. Physiol. 263:H1770–H1778. - PubMed
-
- Bugliarello, G., and J. Sevilla. 1970. Velocity distribution and other characteristics of steady and pulsatile blood flow in fine glass tubes. Biorheology. 7:85–107. - PubMed
Publication types
MeSH terms
LinkOut - more resources
Full Text Sources
Other Literature Sources
