. 2007 May;19(5):958-67.
doi: 10.1016/j.cellsig.2006.11.007. Epub 2006 Nov 25.

ZO-1 is required for protein kinase C gamma-driven disassembly of connexin 43

Affiliations

ZO-1 is required for protein kinase C gamma-driven disassembly of connexin 43

Vladimir Akoyev et al. Cell Signal. 2007 May.

Abstract

We have previously reported that protein kinase C gamma (PKC-gamma) is activated by phorbol-12-myristate-13-acetate (TPA) and that this causes PKC-gamma translocation to membranes and phosphorylation of the gap junction protein, connexin 43 (Cx43). This phosphorylation, on S368 of Cx43, causes disassembly of Cx43 out of cell junctional plaques resulting in the inhibition of dye transfer. The purpose of this study is to identify the specific role of zonula occludens protein-1 (ZO-1), a tight junction protein with recently established effects on gap junctions, in this PKC-gamma-driven Cx43 disassembly. For this purpose, ZO-1 levels in lens epithelial cells in culture were decreased by up to 70% using specific siRNA. The down-regulation of ZO-1 caused a stable interaction of PKC-gamma with Cx43 even without normal enzyme activation by TPA. However, after TPA activation of the PKC-gamma, the Cx43 did not disassemble out of plaques even though the PKC-gamma enzyme was activated and the Cx43 was phosphorylated on S368. Confocal microscopy demonstrated that the siRNA treatment caused a loss of ZO-1 from borders of large junctional Cx43 cell-to-cell plaques and resulted in the accumulation of Cx43 aggregates inside of cells. Loss of the specific "plaquetosome" arrangement of large Cx43 plaques surrounded by ZO-1 was accompanied by a complete loss of functional dye transfer. These results suggest that ZO-1 is required for Cx43 control, both for dye transfer, and, for the PKC-gamma-driven disassembly response.


Figures

Figure 1
Figure 1
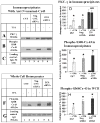
(A) -Western blot analyses of whole cell homogenates (WCH): Lane#1 - control N/N1003A cells (CNT). Lanes # 2-5 - cells after 24-96 hours of Negative Control siRNA transfection (Neg.CNT.siRNA). Lanes #6-9 - after 24-96 hours of ZO1 siRNA transfection (ZO1 siRNA). (B) - ZO1 protein levels in WCH in percentages of control. (CNT, shaded bar), after transfection with ZO1 siRNA (ZO1 siRNA, gray bars), after transfection with negative control siRNA (Neg.CNT.siRNA, empty bars). Both 220 kDa bands were digitized by UN-SCAN-It gel software. Average pixel value for ZO1 bands from control cells was used as a control (CNT) 100% level of ZO1 content. The average pixel value for ZO1 bands in the every other sample was normalized to controls and expressed in percents of control, Mean±SD. Asterisk (*) means that there is a statistical difference (p<0.05) between control and ZO1 siRNA and (**) between negative control siRNA and ZO1 siRNA. (C), (D) and (E) - Western Blot analyses of WCH in the absence (-) and after (+) TPA treatment (300 nM, 20 min, 37°C). Lanes #1-2 - control cells (CNT). Lanes #3-4 - cells after 48h of Negative control siRNA treatment (Neg.CNT.siRNA). Lanes #5-6 - cells after 48h of ZO1 siRNA treatment (ZO1 siRNA). Multiple bands (45 and 47 kDa) for Cx43 are phosphorylated forms of Cx43 detected by anti-N-terminal-Cx43 antisera (Fred Hutchinson Cancer Research Center Seattle, WA) as previously reported [4,30,35,45].
Figure 2
Figure 2
The effect of TPA on PKC-γ activity in whole cell homogenates (WCH) without (-) and after (+) TPA treatment (300 nM, 20 min and 37°C): (A) - An example of photo of the agarose gel demonstrating PKC-γ activity. (CNT.) - control. (Neg.CNT.siRNA) - negative siRNA control. (ZO1 siRNA) - ZO1 siRNA samples. (B) - PKC-γ activity plotted as % of control (Mean±SD). The activity of the immunoprecipitated PKC-γ in the WCH before TPA treatment was considered as a 100%. (CNT) - Control cells, (Neg.CNT.siRNA) - after 48h of transfection with negative control siRNA, (ZO1 siRNA) - after 48h of transfection with ZO1 siRNA. PKC-γ was immunoprecipitated from WCH and was tested using a non-radioactive PKC-assay as described before [23]. Five separate experiments were carried out to gather statistical data for PKC-γ activity. Asterisk (*) means a statistical difference (p<0.05) between control and TPA-treated samples. (C) - Western blot analyses of WCH: Lanes #1-2 - control cells (CNT). Lanes # 3-4 - cells after Negative control siRNA treatment (Neg.CNT.siRNA). Lanes # 5-6 - cells after ZO1 siRNA treatment (ZO1 siRNA). (D) - α-tubulin is included as a loading control.
Figure 3
Figure 3
Confocal images of localized Cx43 and ZO1. Cells were double immunolabeled with both primary monoclonal mouse anti-C-terminal Cx43 IgG and rabbit polyclonal anti ZO1 (middle domain) IgG. Secondary anti-mouse Alexa Fluor-488 (green color) antibodies were used for Cx43 and anti-rabbit Alexa Fluor-568 (red color) antibodies were used for ZO1 (see Material and Methods for details). (a) - (h) - control cells before (a)-(d) and after (e) - (h) TPA treatment (300 nM, 20 min, 37 °C). (a) and (e)- immunolabeled Cx43, (b) and (f)- immunolabeled ZO1, (c) and (g)- merged images. Insertions at right of (c) and (g) demonstrate plaques under high magnification. White square box at lower right corners on the insertions represents area equal to 1 μ2. d,h,l, and p are confocal intensity scans. (i-o) - images of cells after ZO1 siRNA transfection (48h after transfection) without (i-k) and after (m-o) TPA treatment (300 nM, 20 min, 37 °C). Insertion to right of (k and o) demonstrates plaques under high magnification. White arrows indicate junctional plaques between cells or as described in text. Large white bar in the right bottom corner of every picture represents scale bars of 20 microns. (q) - (r) - The total number (Mean±SD) of large plaques (>1μm2) on outer edge of cells (q) and inside cells (r) per cell without (-) and after (+) TPA treatment (300 nM, 20 min, 37 °C). (Control) - control cells; (ZO1 siRNA) - cells transfected with ZO1 siRNA (48 hours after transfection). Asterisk (*) means a statistical difference (p<0.05) between indicated data and control (-TPA).
Figure 4
Figure 4
(A), (B) and (C), - Western blot analyses of proteins coimmunoprecipitated with anti-N-terminal-Cx43 antibodies in the absence (-) or after (+) TPA treatment (300 nM, 20 min, 37 °C). (F) and (G) - Western blot analyses of whole cell homogenates (WCH) in the absence (-) or after (+) TPA treatment (300 nM, 20 min, 37 °C). Lanes #1-2 – intact N/N1003A cells (CNT). Lanes #3-4 - cells after Negative control siRNA treatment (Neg.CNT.siRNA). Lanes #5-6 - cells after 48h of ZO1 siRNA transfection (ZO1 siRNA). Protein levels in immunoprecipitates (D, E) and in the WCH (H) as % of control - (CNT). (Neg.CNT.siRNA) - cells after transfection with negative control siRNA; (ZO1 siRNA) - cells after transfection with ZO1 siRNA. Data plotted as percentage of control (Mean±SD). Asterisk (*) means a statistical difference (p<0.05) between indicated data and controls.
Figure 5
Figure 5
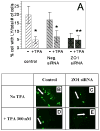
Dye transfer - Gap Junction Activity. (A) - Percent of cells with lucifer yellow without (-) and after (+) TPA treatment (300 nM, 20 min, 37 °C). (BE) – Fluorescent microscopy images of cells along cut/scrape with lucifer yellow minus and plus TPA treatment (300 nM, 20 min, 37 °C). (Control) - Intact N/N1003A cells, (Negative siRNA) - cells treated with negative control siRNA, (ZO1 siRNA) - cells after 48h of transfection with ZO1 siRNA. White arrows show places of the cut. Data plotted as percentage of control (Mean±SD). Asterisk (*) means a statistical difference (p<0.05) between indicated data and control.

Similar articles

Cited by

References

    1. Saez JC, Berthoud VM, Branes MC, Martinez AD, Beyer EC. Physiol Rev. 2003;83:1359–1400. - PubMed
    1. Solan JL, Lampe PD. Biochim Biophys Acta. 2005;1711:154–163. - PubMed
    1. Moreno AP, Saez JC, Fishman GI, Spray DC. Circ Res. 1994;74:1050–1057. - PubMed
    1. Lampe PD, TenBroek EM, Burt JM, Kurata WE, Johnson RG, Lau AF. J Cell Biol. 2000;149:1503–1512. - PMC - PubMed
    1. Bao X, Reuss L, Altenberg GA. J Biol Chem. 2004;279:20058–20066. - PubMed

Publication types

MeSH terms