

Vaccination and the dynamics of immune evasion
- PMID: 17210532
- PMCID: PMC2358969
- DOI: 10.1098/rsif.2006.0167
Vaccination and the dynamics of immune evasion
Abstract
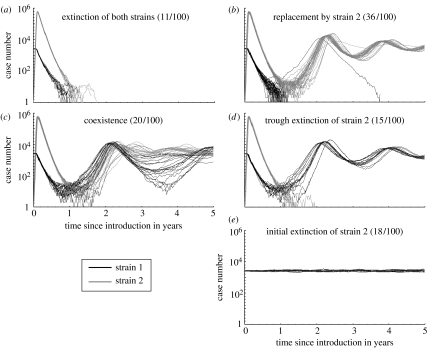
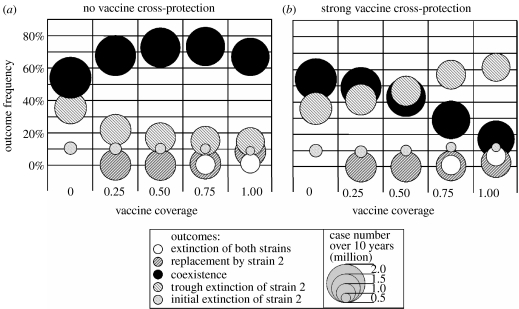
Vaccines exert strong selective pressures on pathogens, favouring the spread of antigenic variants. We propose a simple mathematical model to investigate the dynamics of a novel pathogenic strain that emerges in a population where a previous strain is maintained at low endemic level by a vaccine. We compare three methods to assess the ability of the novel strain to invade and persist: algebraic rate of invasion; deterministic dynamics; and stochastic dynamics. These three techniques provide complementary predictions on the fate of the system. In particular, we emphasize the importance of stochastic simulations, which account for the possibility of extinctions of either strain. More specifically, our model suggests that the probability of persistence of an invasive strain (i) can be minimized for intermediate levels of vaccine cross-protection (i.e. immune protection against the novel strain) and (ii) is lower if cross-immunity acts through a reduced infectious period rather than through reduced susceptibility.
Figures
Similar articles
-
A modelling analysis of pertussis transmission and vaccination in Rio de Janeiro, Brazil.Epidemiol Infect. 2006 Aug;134(4):850-62. doi: 10.1017/S095026880500539X. Epub 2005 Nov 29. Epidemiol Infect. 2006. PMID: 16316489 Free PMC article.
-
The role of B. pertussis vaccine antigen gene variants in pertussis resurgence and possible consequences for vaccine development.Hum Vaccin Immunother. 2016 May 3;12(5):1274-6. doi: 10.1080/21645515.2015.1137402. Epub 2016 Feb 18. Hum Vaccin Immunother. 2016. PMID: 26889694 Free PMC article.
-
Integrating life history and cross-immunity into the evolutionary dynamics of pathogens.Proc Biol Sci. 2006 Feb 22;273(1585):409-16. doi: 10.1098/rspb.2005.3335. Proc Biol Sci. 2006. PMID: 16615206 Free PMC article.
-
Bordetella pertussis, B. parapertussis, vaccines and cycles of whooping cough.Pathog Dis. 2015 Oct;73(7):ftv055. doi: 10.1093/femspd/ftv055. Epub 2015 Aug 4. Pathog Dis. 2015. PMID: 26242280 Review.
-
[Impact of vaccination on the infectious diseases epidemiology: example of pertussis].Med Sci (Paris). 2007 Apr;23(4):399-403. doi: 10.1051/medsci/2007234399. Med Sci (Paris). 2007. PMID: 17433230 Review. French.
Cited by
-
Mathematical model reveals how regulating the three phases of T-cell response could counteract immune evasion.Immunology. 2015 Oct;146(2):271-80. doi: 10.1111/imm.12500. Epub 2015 Aug 2. Immunology. 2015. PMID: 26119966 Free PMC article.
-
Diagnostic testing and the evolution of detection avoidance by pathogens.Evol Med Public Health. 2024 Aug 27;12(1):248-259. doi: 10.1093/emph/eoae018. eCollection 2024. Evol Med Public Health. 2024. PMID: 40375892 Free PMC article.
-
Small mutations in Bordetella pertussis are associated with selective sweeps.PLoS One. 2012;7(9):e46407. doi: 10.1371/journal.pone.0046407. Epub 2012 Sep 28. PLoS One. 2012. PMID: 23029513 Free PMC article.
-
Robust models of disease heterogeneity and control, with application to the SARS-CoV-2 epidemic.PLOS Glob Public Health. 2022 May 9;2(5):e0000412. doi: 10.1371/journal.pgph.0000412. eCollection 2022. PLOS Glob Public Health. 2022. PMID: 36962207 Free PMC article.
-
Impact of viral drift on vaccination dynamics and patterns of seasonal influenza.BMC Infect Dis. 2013 Dec 13;13:589. doi: 10.1186/1471-2334-13-589. BMC Infect Dis. 2013. PMID: 24330575 Free PMC article.
References
-
- Anderson R.M, May R.M. Oxford University Press; Oxford, UK: 1991. Infectious diseases of humans.
-
- Bartlett M.S. Stochastic processes or the statistics of change. Appl. Stat. 1953;2:44–64. doi: 10.2307/2985327. - DOI
MeSH terms
Substances
LinkOut - more resources
Full Text Sources
Medical
Molecular Biology Databases
