. 2007 Mar;27(5):1631-48.
doi: 10.1128/MCB.01993-06. Epub 2007 Jan 8.

CTCF interacts with and recruits the largest subunit of RNA polymerase II to CTCF target sites genome-wide

Affiliations

CTCF interacts with and recruits the largest subunit of RNA polymerase II to CTCF target sites genome-wide

Igor Chernukhin et al. Mol Cell Biol. 2007 Mar.

Abstract

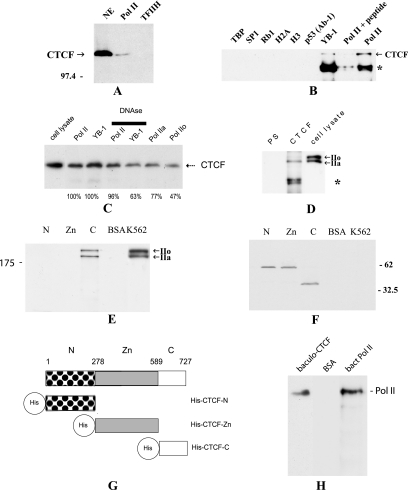
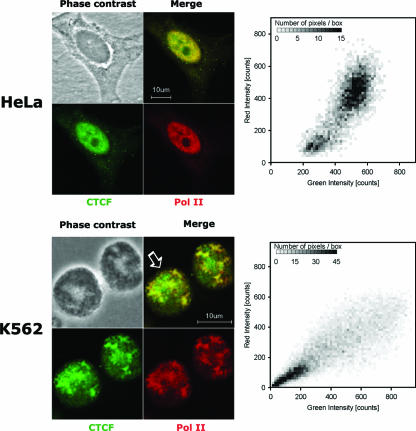
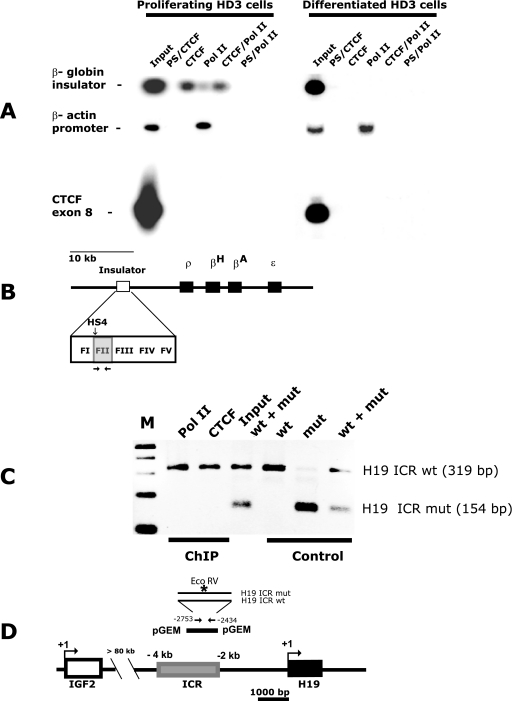
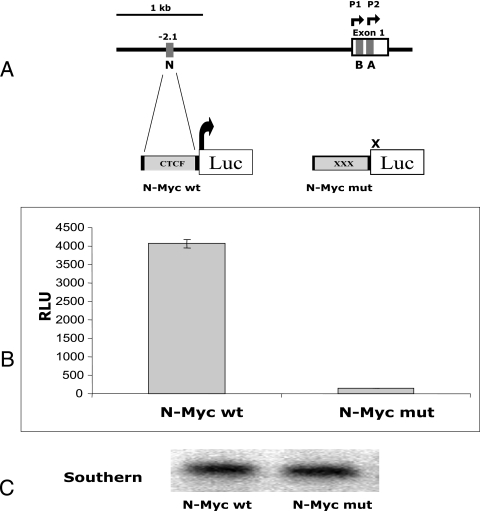
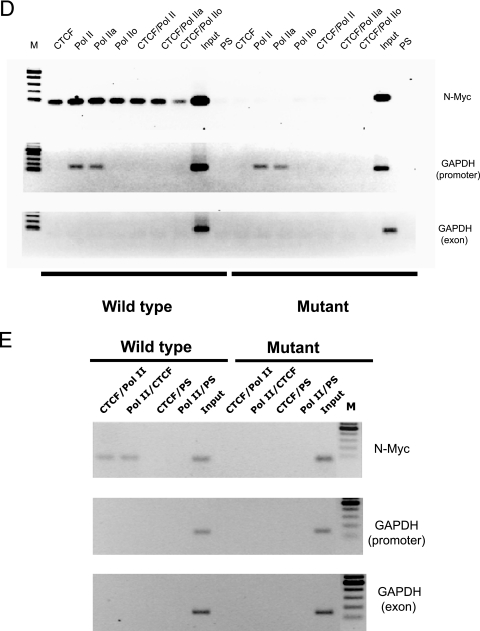
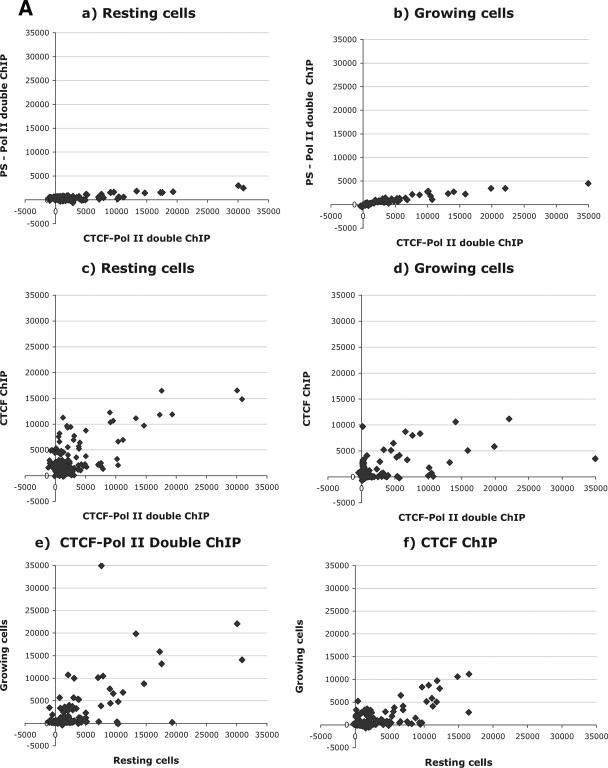
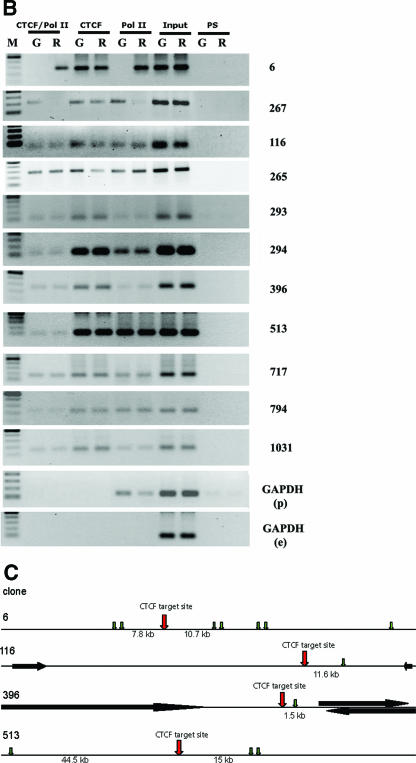
CTCF is a transcription factor with highly versatile functions ranging from gene activation and repression to the regulation of insulator function and imprinting. Although many of these functions rely on CTCF-DNA interactions, it is an emerging realization that CTCF-dependent molecular processes involve CTCF interactions with other proteins. In this study, we report the association of a subpopulation of CTCF with the RNA polymerase II (Pol II) protein complex. We identified the largest subunit of Pol II (LS Pol II) as a protein significantly colocalizing with CTCF in the nucleus and specifically interacting with CTCF in vivo and in vitro. The role of CTCF as a link between DNA and LS Pol II has been reinforced by the observation that the association of LS Pol II with CTCF target sites in vivo depends on intact CTCF binding sequences. "Serial" chromatin immunoprecipitation (ChIP) analysis revealed that both CTCF and LS Pol II were present at the beta-globin insulator in proliferating HD3 cells but not in differentiated globin synthesizing HD3 cells. Further, a single wild-type CTCF target site (N-Myc-CTCF), but not the mutant site deficient for CTCF binding, was sufficient to activate the transcription from the promoterless reporter gene in stably transfected cells. Finally, a ChIP-on-ChIP hybridization assay using microarrays of a library of CTCF target sites revealed that many intergenic CTCF target sequences interacted with both CTCF and LS Pol II. We discuss the possible implications of our observations with respect to plausible mechanisms of transcriptional regulation via a CTCF-mediated direct link of LS Pol II to the DNA.


Figures

FIG. 1.
FIG. 1.
CTCF is associated with LS Pol II in vivo and in vitro. (A) CTCF is a part of the Pol II protein complex. The Pol II and TFIIH complexes were purified, resolved by 10% SDS-PAGE, transferred onto a membrane, and then probed with the anti-CTCF antibody. The band specific for CTCF (indicated) can be seen in the nuclear extract (NE) and in the Pol II complex but not in the TFIIH complex. The position of the molecular marker is indicated on the left. (B) Analysis of the in vivo interactions between CTCF and LS Pol II by coimmunoprecipitation with the anti-LS Pol II antibody. The co-IP reactions were performed with a series of antibodies shown on top of the image; lysates from 5 × 10⁵ HeLa cells were used in each reaction. The arrow signals the position of CTCF coimmunoprecipitated with anti-LS Pol II antibody (N-20) and anti-YB-1 antibody. Preincubation with peptide N-20 can block co-IP with the anti-LS Pol II antibody. On the other hand, CTCF does not coimmunoprecipitate with TBP, Sp1, Rb1, histone H2A, histone H3, or p53 (Ab-1). An ∼85-kDa protein, indicated by the asterisk, is most likely partially reduced IgG (21). (C) Analysis of the interactions between CTCF and LS Pol II pretreated with DNase I and interactions between CTCF, LS Pol IIa, and LS Pol IIo. The antibodies used for co-IP are shown at the top of the image. The anti-LS Pol II antibodies were as follows: the anti-LS Pol II (N-20) antibody that detects both forms of Pol II, the anti-LS Pol II (8WG16) that recognizes the hypophosphorylated LS Pol II (LS Pol IIa), and the anti-LS Pol II (H14) that recognizes the hyperphosphorylated LS Pol II (Pol IIo). Lysates from 5 × 10⁵ HeLa cells were used for each reaction. Samples were electrophoretically separated, blotted, and probed with the anti-CTCF antibody. The arrow signals the position of CTCF. The developed films were scanned, and images were quantified. Levels of CTCF precipitated by the anti-Pol IIa and anti-Pol IIo antibodies and anti-Pol II treated with DNase I prior to co-IP are presented as a percentage from the co-IP reactions with the anti-Pol II (N-20) antibody (designated as 100%). An amount of CTCF precipitated by the anti-YB-1 antibody after treatment with DNase I is presented as a percentage from the co-IP reaction with the anti-YB-1 antibody (designated as 100%). Numbers below the lanes represent these results. (D) Analysis of the in vivo interactions between CTCF and LS Pol II by immunoprecipitation with the anti-CTCF antibodies. A Western blot assay with anti-LS Pol II antibody (N-20) was performed after co-IP from HeLa lysates with PS or anti-CTCF antibody (CTCF); 5 × 10⁵ HeLacells were used for each reaction. The immunocomplexes were resolved by SDS-PAGE and blotted, and the membrane was probed with the anti-LS Pol II antibody N-20. Arrows on the right indicate the positions of the hypophosphorylated LS Pol II (IIa), sized 220 kDa, and the hyperphosphorylated LS Pol II (IIo), sized 240 kDa. An ∼85-kDa protein (depicted by the asterisk) is most likely partially reduced immunoglobulin G (21). (E) The C-terminal domain of CTCF interacts with LS Pol II in vitro. The three domains of CTCF (CTCF-N [N], CTCF-Zn [Zn], and CTCF-C [C]) expressed in E. coli and BSA (control) were coupled to the matrix and incubated with the whole lysate from K562 cells and washed with 0.25 M RIPA buffer, and the retained proteins were analyzed by a Western blot assay with the anti-LS-Pol II antibody. Arrows indicate the positions of two forms of the LS Pol II. K562, 20 μl of K562 cell lysate used in the assay. The position of the molecular marker is indicated on the left. (F) Analysis of the proteins used in the interaction assay. The membrane utilized in the experiment described for panel E was stripped and subsequently probed with the anti-His tag antibodies. The positions of the molecular markers are indicated on the right. (G) Three-domain structure of CTCF. The three domains of CTCF are depicted as follows: N, N-terminal domain (patterned box); Zn, 11-Zn-finger domain (gray box); and C, C-terminal (open box) domain. The His tags are shown as open circles. Amino acids are numbered as in Filippova et al. (16). (H) The full-length CTCF and LS Pol II interact directly in vitro. The complete peptides of CTCF (baculoCTCF) and LS Pol II (bactLS Pol II) were generated in vitro using baculoviral and bacterial systems, respectively. baculoCTCF and BSA were coupled to the matrix, incubated with the lysate containing bactLS Pol II, and washed with 0.25 M RIPA buffer, and the retained proteins were analyzed by a Western blot assay with anti-LS-Pol II antibody. The position of the bactLS Pol II is shown.
FIG. 2.
FIG. 2.
Confocal analysis of CTCF and LS Pol II in HeLa and K562 cells. HeLa and K562 cell lines were prepared and immunostained as described in Materials and Methods. The endogenous CTCF and LS Pol II proteins are extensively colocalized in the nucleus in both cell lines (HeLa, upper panel, and K562, lower panel) as shown by the merge of the CTCF (fluorescein isothiocyanate; green) and Pol II (tetramethyl rhodamine isocyanate; red) staining and colocalization analysis using the methods of Costes et al. (11). The typical two-dimensional histograms of the fluorescence for a K562 cell (indicated by the arrow) and a HeLa cell are shown.
FIG. 3.
FIG. 3.
CTCF and LS Pol II interact in vivo at the β-globin insulator and the H19 ICR. (A) CTCF and LS Pol II are associated at the β-globin insulator in proliferating HD3 cells as shown by ChIP and serial ChIP assays. Nuclear extracts were prepared from 5 × 10⁶ of proliferating and differentiated HD3 cells; the standard ChIP assay was performed to assess the in vivo occupancies at the DNA target sites, and the serial ChIP assay was performed to assess the simultaneous presence of CTCF and LS Pol II at the β-globin insulator. PCR products were resolved by a 1% agarose gel, and a Southern blot assay was performed with the 32P-labeled β-globin insulator FII probe. PCR and hybridization with the CTCF exon 8 and chicken β-actin probes were used as a background control and as a LS Pol II loading control, respectively (see Table 1 for details of the hybridization probes). The antibodies used in ChIP and serial ChIP assays are indicated above the corresponding lanes as follows: PS/CTCF, serial ChIP with PS, followed by the anti-CTCF antibody; CTCF, ChIP with the anti-CTCF antibody; Pol II, ChIP with the anti-LS Pol II antibody; CTCF/Pol II, serial ChIP with the anti-CTCF antibody, followed by the anti-LS Pol II antibody; PS/Pol II, serial ChIP with PS, followed by the anti-LS Pol II antibody; input, DNA from HD3 cell lysates. (B) Cartoon illustration of the chicken β-globin domain (3, 46). The 1.2-kb insulator core element is shown as an open box; the detailed structure is represented in the enlarged image. CTCF binds to the 42-bp F II region within the insulator (gray box). The four β-globin genes are shown as black boxes. The hypersensitive site HS4 is indicated with a vertical arrow. Primers used for amplification of the FII are shown by horizontal arrows (the sequences of the primers are given in Table 1). (C) LS Pol II association with the H19 ICR requires functional CTCF target sites. pGEM vectors containing the wt and mut 1.2-kb H19 ICRs were transfected into JEG-3 cells individually or mixed together (+) as indicated. The image shows DNA amplified from ChIP material pulled down by CTCF and LS Pol II antibodies or control material, not subjected to ChIP, digested with EcoRV. The antibodies used in the assay are indicated above the corresponding lanes. The PCR products were resolved by a 1% agarose gel. M, DNA marker (100-bp DNA ladder). (D) Cartoon illustration of the IGF2-H19 locus (2). The positions of IGF2 (white box) and H19 (black box) genes are shown. The 2.4-kb H19 ICR element (gray box) is located −2 kb to −4.4 kb relative to the transcription start site of H19 (58). The IGF2 and H19 ICRs are separated by more than 80 kb of intervening sequences. Transcription start sites of IGF2 and H19 are presented by bent arrows. The 1.2-kb H19 ICR fragment cloned into pGEM vector is shown as a black bar. Primers used for H19 ICR amplification are denoted by straight arrows (sequences of the primers are given in Table 1). The sequence recognized by EcoRV is specific for the mutated CTCF target site 3 (indicated by an asterisk) (44).
FIG. 4.
FIG. 4.
CTCF and LS Pol II are associated with wild-type N-Myc, which alone can activate transcription from the luciferase reporter gene. (A) Cartoon illustration of the 5′ noncoding region of the human c-myc gene promoter (16). Gray boxes depict the CTCF binding sites A, B, and N (38). (B) The wild-type N-Myc sequence activates the luciferase reporter gene. The NIH 3T3 cells stably transfected with pN-Myc-Luc wt and pN-MycLuc mut were harvested and assayed for luciferase activity as described in Materials and Methods. The luciferase activity normalized to the plasmid copy number is shown in relative luciferase units (RLU). Each bar represents an average of three experiments performed in triplicate. The error bar indicates standard deviation. Panel A shows the structure of the two plasmids, pN-Myc-Luc wt and pN-MycLuc mut. Gray boxes depict N-Myc sites. Luc, luciferase reporter gene. (C) Southern blot analysis of the DNA extracted from NIH 3T3 cells (pN-Myc-Luc wt and pN-MycLuc mut). Genomic DNA was extracted, digested with ClaI/XhoI, blotted, and hybridized as described in Materials and Methods. (D) CTCF and LS Pol II are associated with the wild-type N-Myc site in stably transfected NIH 3T3 cells. Standard ChIP and serial ChIP assays were performed to assess the in vivo occupancies by CTCF and Pol II at the N-Myc target sites. The antibodies used in ChIP and serial ChIP are indicated above the corresponding lanes as follows: CTCF, ChIP with the anti-CTCF antibody; Pol II, ChIP with the anti-LS Pol II antibody; Pol IIa, ChIP with the anti-LS Pol IIa antibody (hypophosphorylated form); Pol IIo, ChIP with the anti-LS Pol IIo antibody (hyperphosphorylated form); CTCF/Pol II, serial ChIP with the anti-CTCF antibody, followed by the anti-LS Pol II antibody; CTCF/Pol IIa, serial ChIP with the anti-CTCF antibody, followed by the anti-LS Pol IIa antibody; CTCF/Pol IIo, serial ChIP with the anti-CTCF antibody, followed by the anti-LS Pol IIo antibody; PS, ChIP with preimmune serum; input, DNA from NIH 3T3 cell lysates. DNA prepared from these samples was amplified using corresponding pairs of primers as described in Materials and Methods and in Table 1. The PCR products were resolved in a 1% agarose gel. M, DNA marker (100-bp DNA ladder). (E) CTCF and LS Pol II association with the wild-type N-Myc site in stably transfected NIH 3T3 cells is specific. The serial ChIP assays were performed to further assess the specificity of the in vivo occupancies by CTCF and Pol II at the N-Myc target sites. The antibodies used in ChIP and serial ChIP are indicated above the corresponding lanes as follows: CTCF/Pol II, serial ChIP with the anti-CTCF antibody, followed by the anti-LS Pol II antibody; Pol II/CTCF, serial ChIP with the anti-LS Pol II antibody, followed by the anti-CTCF antibody; CTCF/PS, serial ChIP with the anti-CTCF antibody, followed by PS; Pol II/PS, serial ChIP with the anti-LS Pol II antibody, followed by PS. Input, DNA from NIH 3T3 cell lysates. DNA prepared from these samples was amplified using corresponding pairs of primers as described in Materials and Methods and in Table 1. The PCR products were resolved in a 1% agarose gel. M, DNA marker (100-bp ladder).
FIG. 4.
FIG. 4.
CTCF and LS Pol II are associated with wild-type N-Myc, which alone can activate transcription from the luciferase reporter gene. (A) Cartoon illustration of the 5′ noncoding region of the human c-myc gene promoter (16). Gray boxes depict the CTCF binding sites A, B, and N (38). (B) The wild-type N-Myc sequence activates the luciferase reporter gene. The NIH 3T3 cells stably transfected with pN-Myc-Luc wt and pN-MycLuc mut were harvested and assayed for luciferase activity as described in Materials and Methods. The luciferase activity normalized to the plasmid copy number is shown in relative luciferase units (RLU). Each bar represents an average of three experiments performed in triplicate. The error bar indicates standard deviation. Panel A shows the structure of the two plasmids, pN-Myc-Luc wt and pN-MycLuc mut. Gray boxes depict N-Myc sites. Luc, luciferase reporter gene. (C) Southern blot analysis of the DNA extracted from NIH 3T3 cells (pN-Myc-Luc wt and pN-MycLuc mut). Genomic DNA was extracted, digested with ClaI/XhoI, blotted, and hybridized as described in Materials and Methods. (D) CTCF and LS Pol II are associated with the wild-type N-Myc site in stably transfected NIH 3T3 cells. Standard ChIP and serial ChIP assays were performed to assess the in vivo occupancies by CTCF and Pol II at the N-Myc target sites. The antibodies used in ChIP and serial ChIP are indicated above the corresponding lanes as follows: CTCF, ChIP with the anti-CTCF antibody; Pol II, ChIP with the anti-LS Pol II antibody; Pol IIa, ChIP with the anti-LS Pol IIa antibody (hypophosphorylated form); Pol IIo, ChIP with the anti-LS Pol IIo antibody (hyperphosphorylated form); CTCF/Pol II, serial ChIP with the anti-CTCF antibody, followed by the anti-LS Pol II antibody; CTCF/Pol IIa, serial ChIP with the anti-CTCF antibody, followed by the anti-LS Pol IIa antibody; CTCF/Pol IIo, serial ChIP with the anti-CTCF antibody, followed by the anti-LS Pol IIo antibody; PS, ChIP with preimmune serum; input, DNA from NIH 3T3 cell lysates. DNA prepared from these samples was amplified using corresponding pairs of primers as described in Materials and Methods and in Table 1. The PCR products were resolved in a 1% agarose gel. M, DNA marker (100-bp DNA ladder). (E) CTCF and LS Pol II association with the wild-type N-Myc site in stably transfected NIH 3T3 cells is specific. The serial ChIP assays were performed to further assess the specificity of the in vivo occupancies by CTCF and Pol II at the N-Myc target sites. The antibodies used in ChIP and serial ChIP are indicated above the corresponding lanes as follows: CTCF/Pol II, serial ChIP with the anti-CTCF antibody, followed by the anti-LS Pol II antibody; Pol II/CTCF, serial ChIP with the anti-LS Pol II antibody, followed by the anti-CTCF antibody; CTCF/PS, serial ChIP with the anti-CTCF antibody, followed by PS; Pol II/PS, serial ChIP with the anti-LS Pol II antibody, followed by PS. Input, DNA from NIH 3T3 cell lysates. DNA prepared from these samples was amplified using corresponding pairs of primers as described in Materials and Methods and in Table 1. The PCR products were resolved in a 1% agarose gel. M, DNA marker (100-bp ladder).
FIG. 5.
FIG. 5.
Genome-wide interaction between CTCF and LS Pol II. (A) ChIP-on-ChIP hybridization analysis revealing the simultaneous presence of CTCF and LS-Pol II epitopes genome-wide. DNA samples from the standard ChIP or serial ChIP assays from proliferating and resting mouse NIH 3T3 cells were prepared and hybridized to CTCF target site microarrays. Hybridization signals are expressed in relative fluorescence units; the results of analyses are presented in scatter plots as follows. (a) Comparison of hybridization data between serial ChIP samples CTCF-Pol II and preimmune serum-Pol II in resting cells. (b) Comparison of hybridization data between serial ChIP samples CTCF-Pol II and preimmune serum-Pol II in growing cells. (c) Comparison of the CTCF ChIP with the CTCF-Pol II serial ChIP signals in resting cells. (d) Comparison of the CTCF ChIP with the CTCF-Pol II serial ChIP signals in growing cells. (e) Comparison between serial ChIP CTCF-Pol II samples in resting and growing cells. (f) Comparison between single CTCF ChIP/CTCF ChIP signals in resting and growing cells. (B) Analysis of the 11 sequences in growing (G) or resting (R) NIH 3T3 identified by screening of the CTCF target site microarrays demonstrating the simultaneous presence of CTCF and LS-Pol II. Proliferating and resting mouse NIH 3T3 cells were used to perform the standard ChIP or serial ChIP assays. The antibodies used in ChIP and serial ChIP assays are indicated above the corresponding lanes as follows: CTCF/Pol II, serial ChIP with the anti-CTCF antibody, followed by the anti-LS Pol II antibody; CTCF, ChIP with the anti-CTCF antibody; Pol II, ChIP with the anti-LS Pol II antibody (Pol II); PS, ChIP with the preimmune serum. Input, DNA from NIH 3T3 cell lysates. DNA prepared from these samples was amplified using corresponding pairs of primers as described in Materials and Methods and Table 1, and resolved by a 1% agarose gel. M, DNA marker (100-bp DNA ladder); GAPDH (p), promoter region of GAPDH; GAPDH (e), exon 1 region of GAPDH. (C) A gene map depicting the location of transcriptional units of identified genes (black arrows) or ESTs (green arrows). The numbers below each row indicate the distance between the CTCF target site and the closest known transcriptional unit. Additional sequences are described in Table 3.
FIG. 5.
FIG. 5.
Genome-wide interaction between CTCF and LS Pol II. (A) ChIP-on-ChIP hybridization analysis revealing the simultaneous presence of CTCF and LS-Pol II epitopes genome-wide. DNA samples from the standard ChIP or serial ChIP assays from proliferating and resting mouse NIH 3T3 cells were prepared and hybridized to CTCF target site microarrays. Hybridization signals are expressed in relative fluorescence units; the results of analyses are presented in scatter plots as follows. (a) Comparison of hybridization data between serial ChIP samples CTCF-Pol II and preimmune serum-Pol II in resting cells. (b) Comparison of hybridization data between serial ChIP samples CTCF-Pol II and preimmune serum-Pol II in growing cells. (c) Comparison of the CTCF ChIP with the CTCF-Pol II serial ChIP signals in resting cells. (d) Comparison of the CTCF ChIP with the CTCF-Pol II serial ChIP signals in growing cells. (e) Comparison between serial ChIP CTCF-Pol II samples in resting and growing cells. (f) Comparison between single CTCF ChIP/CTCF ChIP signals in resting and growing cells. (B) Analysis of the 11 sequences in growing (G) or resting (R) NIH 3T3 identified by screening of the CTCF target site microarrays demonstrating the simultaneous presence of CTCF and LS-Pol II. Proliferating and resting mouse NIH 3T3 cells were used to perform the standard ChIP or serial ChIP assays. The antibodies used in ChIP and serial ChIP assays are indicated above the corresponding lanes as follows: CTCF/Pol II, serial ChIP with the anti-CTCF antibody, followed by the anti-LS Pol II antibody; CTCF, ChIP with the anti-CTCF antibody; Pol II, ChIP with the anti-LS Pol II antibody (Pol II); PS, ChIP with the preimmune serum. Input, DNA from NIH 3T3 cell lysates. DNA prepared from these samples was amplified using corresponding pairs of primers as described in Materials and Methods and Table 1, and resolved by a 1% agarose gel. M, DNA marker (100-bp DNA ladder); GAPDH (p), promoter region of GAPDH; GAPDH (e), exon 1 region of GAPDH. (C) A gene map depicting the location of transcriptional units of identified genes (black arrows) or ESTs (green arrows). The numbers below each row indicate the distance between the CTCF target site and the closest known transcriptional unit. Additional sequences are described in Table 3.

References

    1. Acker, J., M. de Graaff, I. Cheynel, V. Khazak, C. Kedinger, and M. Vigneron. 1997. Interactions between the human RNA polymerase II subunits. J. Biol. Chem. 272:16815-16821. - PubMed
    1. Bell, A. C., and G. Felsenfeld. 2000. Methylation of a CTCF-dependent boundary controls imprinted expression of the Igf2 gene. Nature 405:482-485. - PubMed
    1. Bell, A. C., A. G. West, and G. Felsenfeld. 1999. The protein CTCF is required for the enhancer blocking activity of vertebrate insulators. Cell 98:387-396. - PubMed
    1. Besse, S., M. Vigneron, E. Pichard, and F. Puvion-Dutilleul. 1995. Synthesis and maturation of viral transcripts in herpes simplex virus type 1 infected HeLa cells: the role of interchromatin granules. Gene Expr. 4:143-161. - PMC - PubMed
    1. Beug, H., G. Doederlein, C. Freudenstein, and T. Graf. 1982. Erythroblast cell lines transformed by a temperature-sensitive mutant of avian erythroblastosis virus: a model system to study erythroid differentiation in vitro. J. Cell. Physiol. Suppl. 1:195-207. - PubMed

Publication types

MeSH terms