. 2007 Jan 22;204(1):153-60.
doi: 10.1084/jem.20061918. Epub 2007 Jan 8.

Igkappa allelic inclusion is a consequence of receptor editing

Affiliations

Igkappa allelic inclusion is a consequence of receptor editing

Rafael Casellas et al. J Exp Med. .

Abstract

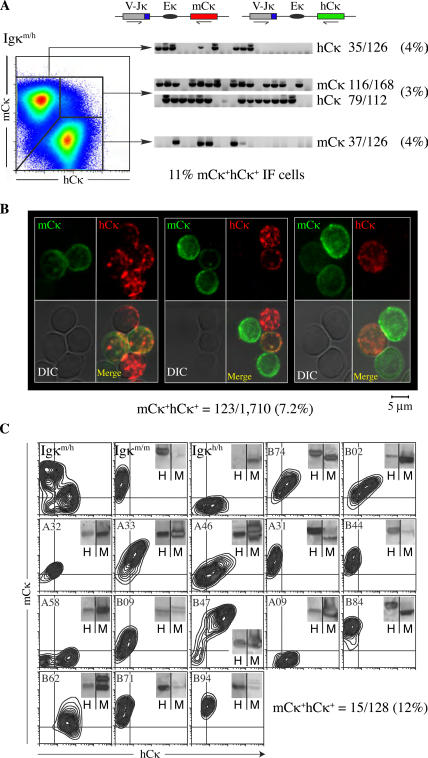
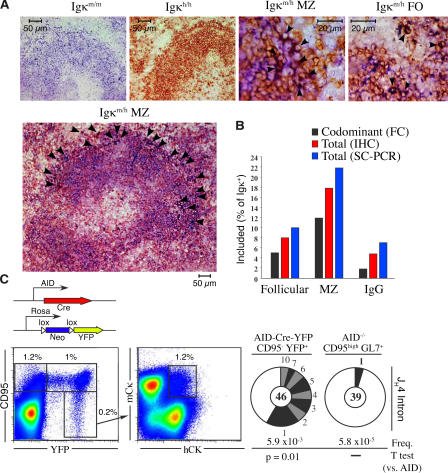
The discovery of lymphocytes bearing two light chains in mice carrying self-reactive antibody transgenes has challenged the "one lymphocyte-one antibody" rule. However, the extent and nature of allelically included cells in normal mice is unknown. We show that 10% of mature B cells coexpress both Igkappa alleles. These cells are not the result of failure in allelic exclusion per se, but arise through receptor editing. We find that under physiological conditions, editing occurs both by deletion and by inclusion with equal probability. In addition, we demonstrate that B lymphocytes carrying two B-cell receptors are recruited to germinal center reactions, and thus fully participate in humoral immune responses. Our data measure the scope of allelic inclusion and provide a mechanism whereby autoreactive B cells might "escape" central tolerance.


Figures

Figure 1.
Figure 1.
Allelic inclusion in Igκm/h mice. (A) Left pseudocolor plot shows analysis of mouse and human κ expression in Igκm/h splenocytes gated on B220+Igλ and stained with rat monoclonal antibodies against mCκ and hCκ. Numbers indicate percentages of gated lymphocytes. VJκ-mCκ and -hCκ transcripts (top schematics) were amplified by RT-PCR from single cells sorted from mCκ+, hCκ+, and mCκ+hCκ+ fractions. Numbers in parentheses represent percentage of in-frame transcripts amplified from the various fractions of total B220+ B cells (a more detailed analysis is given in Table S1). TO-PRO3 was used to exclude dead cells from analysis. (B) Igκ protein expression in Igκm/h lymphocytes. Total splenic B cells were enriched by magnetic bead depletion of nonB cells and stained with anti-hCκ (red, Alexa Fluor 546) and anti-mCκ (green, Alexa Fluor 488). Cells were cytospun and analyzed by confocal microscopy. Values were summed from two independent experiments (1,192 and 518 cells scored). This analysis was also reproduced using a colorimetric assay on additional mice (Fig. S1). (C) mCκ and hCκ expression in 15 allelically included Igκm/h hybridomas (from a total of 128), as determined by flow cytometry (contour plots) and Western blot (insets). Control staining included splenocytes from Igκm/m and Igκh/h mice (first two plots). Fig. S1 and Table S1 are available at http://www.jem.org/cgi/content/full/jem.20061918/DC1).
Figure 2.
Figure 2.
Allelically included B cells result from receptor editing. (A) Kinetics of bone marrow development of included and excluded B cells. Linear regression analysis shows the percentage of B220lowBrdU+ B cells plotted against time. Percentage values of excluded mCκ+ (blue ovals) and hCκ+ (green squares) cells are represented in the left y axis, and the percentage of mCκ+hCκ+-included cells (red circles) is depicted in the right y axis. Igκm/h mice were injected with 0.5 mg of BrdU intraperitoneally and killed after 6, 12, 18, 24, and 48 h (three mice per time point). Cells were permeabilized and stained with anti–BrdU-APC, mCκ-PE, hCκ-FITC, and B220-PerCP antibodies. (B) Comparative analysis of Jκ usage (percentage) in allelically included (red bars; n = 168 transcripts) and excluded (blue bars; n = 233 transcripts) B cells. (C) Antibodies purified from the supernatants of 15 mCκ+hCκ+ hybridoma clones were compared with 38 antibodies from hybridomas expressing only one allele for binding to HEp-2 cells and double-stranded DNA. HEp-2 binding was compared with positive and negative control sera provided by the manufacturer. To ensure HEp-2 binding was not caused by xenoreactivity, self-specificities were verified by a commercial ANA assay designed for mice (not depicted).
Figure 3.
Figure 3.
Allelically included B cells home preferentially to MZs and participate in the germinal center reaction. (A) Control spleen sections from Igκm/m and Igκh/h mice (first and second images, respectively) were stained with antibodies against mCκ (blue) and hCκ (brown). Allelically included cells (dark brown) are identified with arrowheads. (B) Frequency of included lymphocytes in follicular, MZ, and IgG+ B cell populations, as determined by flow cytometry (FC), immunohistochemistry (IHC), and single-cell PCR (SC-PCR). (C) To permanently tag the progeny of germinal center cells, mice expressing the Cre recombinase gene under the AID promoter were crossed to Rosa-neo-YFP transgenic mice (schematic). In AID-Cre-YFP mice B220+CD95high, germinal center B cells are permanently labeled with YFP (1% of total B220+), and recirculating postgerminal center cells are identified as B220+CD95YFP+ (0.2% of B220+, left pseudocolor plot). Allelic inclusion is assessed in postgerminal center Igκm/h cells (1.2%, right pseudocolor plot). Mutation analysis of JH4 intron from B220+CD95YFP+ postgerminal center and B220+CD95highAID−/− germinal center cells is shown with pie charts. Segment sizes in the pie charts are proportional to the number of sequences carrying the number of mutations indicated in the periphery of the charts. The frequency of mutations per base pair sequenced and the total number of independent sequences analyzed is indicated underneath and in the center of each chart, respectively. Statistical significance was determined by a two-tailed Student's t test assuming unequal variance and comparing to AID−/−.
Figure 4.
Figure 4.
Extent of allelic inclusion in the edited B-cell compartment. (A) IgκαHEL/h splenic B cells were isolated by single-cell sorting, and 387 Igκ transcripts were amplified by RT-PCR and analyzed by sequencing (top). From this analysis, six populations were characterized as shown (bottom). The VκαHEL prerecombined light chain is depicted by a yellow rectangle, and secondary recombination events at the mCκ and hCκ alleles are depicted with red or blue rectangles, respectively. OOF rearrangements are depicted by rectangles with a slash, and use of the lambda locus is represented with a green rectangle. (B) Analysis of in-frame and OOF status of Igκ transcripts in IgκαHEL/h or Igκm/h B cells. IgκαHEL/h cells were the same as those shown in A.

References

    1. Tonegawa, S. 1983. Somatic generation of antibody diversity. Nature. 302:575–581. - PubMed
    1. Gay, D., T. Saunders, S. Camper, and M. Weigert. 1993. Receptor editing: an approach by autoreactive B cells to escape tolerance. J. Exp. Med. 177:999–1008. - PMC - PubMed
    1. Goodnow, C.C., J. Crosbie, S. Adelstein, T.B. Lavoie, S.J. Smith-Gill, R.A. Brink, H. Pritchard-Briscoe, J.S. Wotherspoon, R.H. Loblay, K. Raphael, et al. 1988. Altered immunoglobulin expression and functional silencing of self-reactive B lymphocytes in transgenic mice. Nature. 334:676–682. - PubMed
    1. Tiegs, S.L., D.M. Russell, and D. Nemazee. 1993. Receptor editing in self-reactive bone marrow B cells. J. Exp. Med. 177:1009–1020. - PMC - PubMed
    1. Okamoto, M., M. Murakami, A. Shimizu, S. Ozaki, T. Tsubata, S. Kumagai, and T. Honjo. 1992. A transgenic model of autoimmune hemolytic anemia. J. Exp. Med. 175:71–79. - PMC - PubMed

Publication types