. 2007 Jan 1;21(1):98-111.
doi: 10.1101/gad.1480007.

Bcl2L12 inhibits post-mitochondrial apoptosis signaling in glioblastoma

Affiliations

Bcl2L12 inhibits post-mitochondrial apoptosis signaling in glioblastoma

Alexander H Stegh et al. Genes Dev. .

Erratum in

  • Genes Dev. 2007 Feb 15;21(4):481

Abstract

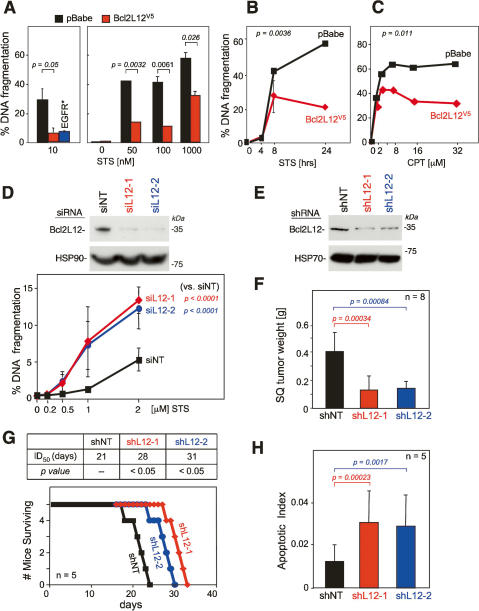
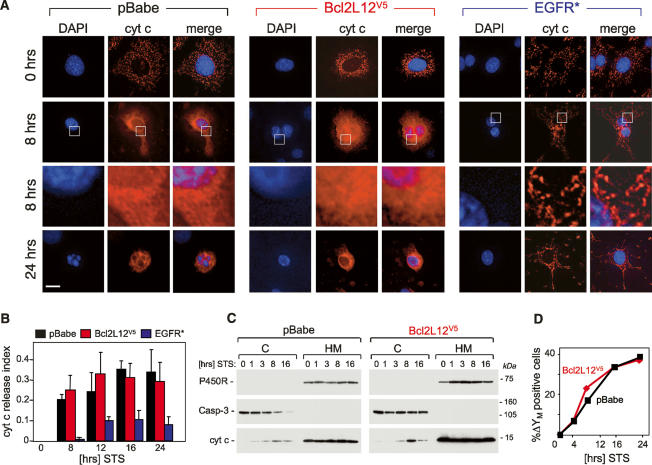
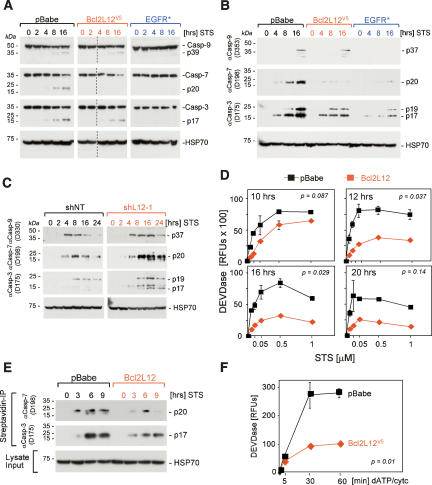
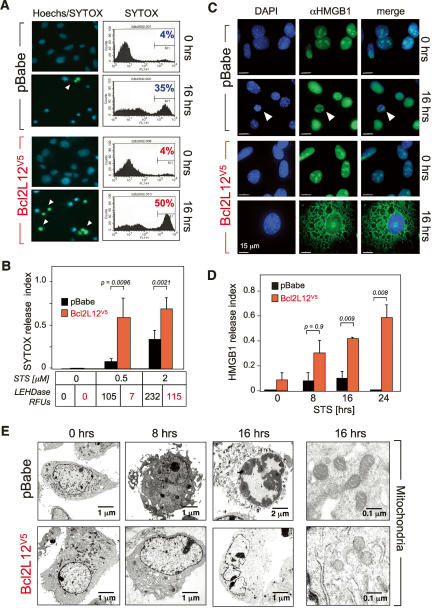
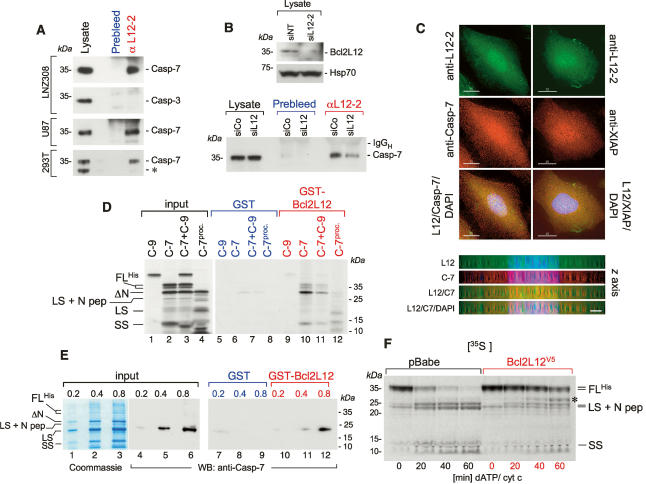
Glioblastoma (GBM) is an astrocytic brain tumor characterized by an aggressive clinical course and intense resistance to all therapeutic modalities. Here, we report the identification and functional characterization of Bcl2L12 (Bcl2-like-12) that is robustly expressed in nearly all human primary GBMs examined. Enforced Bcl2L12 expression confers marked apoptosis resistance in primary cortical astrocytes, and, conversely, its RNA interference (RNAi)-mediated knockdown sensitizes human glioma cell lines toward apoptosis in vitro and impairs tumor growth with increased intratumoral apoptosis in vivo. Mechanistically, Bcl2L12 expression does not affect cytochrome c release or apoptosome-driven caspase-9 activation, but instead inhibits post-mitochondrial apoptosis signaling at the level of effector caspase activation. One of Bcl2L12's mechanisms of action stems from its ability to interact with and neutralize caspase-7. Notably, while enforced Bcl2L12 expression inhibits apoptosis, it also engenders a pronecrotic state, which mirrors the cellular phenotype elicited by genetic or pharmacologic inhibition of post-mitochondrial apoptosis molecules. Thus, Bcl2L12 contributes to the classical tumor biological features of GBM such as intense apoptosis resistance and florid necrosis, and may provide a target for enhanced therapeutic responsiveness of this lethal cancer.


Figures

Figure 1.
Figure 1.
Bcl2L12 inhibits apoptosis. (A) Ink4a/Arf−/− astrocytes stably expressing pBabe, Bcl2L12V5, or EGFR* were treated with the pan-specific kinase inhibitor STS for 24 h at a concentration of 10 nM (left) and with increasing doses of STS for 20 h (right). Apoptosis was measured by FACS-based quantification of DNA fragmentation. (B) pBabe- and Bcl2L12-expressing astrocytes were treated with 1 μM STS for the indicated periods of time, and DNA fragmentation was assessed. The p value was calculated for the 24-h time point. (C) DNA fragmentation of Ink4a/Arf-deficient astrocytes expressing pBabe or Bcl2L12V5 treated with CPT at indicated dosages was measured by FACS-based quantification of sub-G1 DNA content. The p value was calculated for the 32 μM doses. (D, top) Efficient knockdown of Bcl2L12 in U87MG glioma cells by two independent siRNAs (siL12-1 and siL12-2) relative to nontargeting control (siNT) was documented by Western blot analysis at 48 h post-transfection using the anti-L12-1 antibody (1 μg/mL). (Bottom) Knockdown of Bcl2L12 in U87MG glioma cells resulted in enhanced sensitivity to STS-induced apoptosis as measured by DNA fragmentation. Depicted is the mean of three independent experiments (n = 3) performed in duplicate. Error bars represent standard deviations across all experiments. Comparable results were obtained in three additional GBM cell lines (LN443, LN382, and LNZ308) (data not shown). To assess the statistical significance across all experiments, we also calculated p values for one concentration (1 μM STS) for all cell lines tested. Specifically, we “normalized” all siL12-1 and siL12-2 data points to siNT controls at 1 μM STS concentration by dividing the mean of all data points for siL12-1 and siL12-2 by the means of siNT yielding fold increase in DNA fragmentation (sensitization index) for each cell line. In this manner, we accounted for baseline cell line-specific apoptosis sensitivities. At 1 μM STS, the sensitization indices thus calculated are (Mean ± SD) 1.51 ± 0.45 with p = 0.01 for siL12-1 and 1.66 ± 0.46 with p = 0.003 for siL12-2 (n = 7). (E) Stable knockdown of Bcl2L12 in U87MG glioma cells by two independent shRNAs (shL12-1 and shL12-2) relative to nontargeting control (shNT) was documented by Western blot analysis using the anti-L12-1 antibody (1 μg/mL). (F) Stable knockdown of Bcl2L12 reduces subcutaneous tumor formation (n = 8) by U87MG cells in SCID mice. (G) Stable knockdown of Bcl2L12 increased survival of SCID animals (n = 5) after intracranial injection of U87MG glioma cells. (H) Resultant tumors showed enhanced apoptosis as measured by the fraction of TUNEL-positive nuclei (700 nuclei were counted per tumor section). Detailed histology on intracranial tumors (see Supplementary Fig. S3) was performed on an independent cohort of animals. All experiments were performed in duplicate or triplicate; error bars represent standard deviations of replicate data points, and two-tailed p values were calculated using the Student’s t-test.
Figure 2.
Figure 2.
Impact of Bcl2L12 overexpression on mitochondrial integrity following exposure to an apoptotic stimulus. (A) pBabe-, Bcl2L12-, and EGFR*-expressing Ink4a/Arf-deficient astrocytes were treated with 100 nM STS for the indicated periods of time, subjected to immunofluorescence using a monoclonal anti-cytochrome c antibody, and analyzed by deconvolution immunofluorescence microscopy. DAPI, cytochrome c immunofluorescences, and merge images are shown. The framed areas in row 2 were enlarged (row 3) to further document diffuse cytochrome c staining in pBabe and Bcl2L12V5 astrocytes and preserved mitochondrial cytochrome c localization in EGFR* cultures. (B) Cytochrome c release was quantified by counting cells with diffuse cytosolic cytochrome c staining and presented as a fraction of the total number of cells counted (index). Three HPFs were counted; error bars represent standard deviations, and two-tailed p values were calculated using the Student’s t-test (p < 0.05 for pBabe vs. EGFR* at all time points of STS stimulation). (C) Ink4a/Arf−/− astrocytes ectopically expressing pBabe or Bcl2L12V5 were treated with STS (1 μM) for the indicated periods of time. Cytosolic (C) and membranous (M) compartments were isolated and subjected to Western blot analysis to determine cytochrome c distribution. Caspase-3 and cytochrome P450 reductase are shown as marker proteins assessing equal loading and fraction purity. (D) Bcl2L12 does not protect inner mitochondrial membrane integrity. Bcl2L12V5- and pBabe-expressing Ink4a/Arf−/− astrocytes were treated with STS (1 μM) for the indicated periods of time, and the mitochondrial transmembrane potential (ΔΨM) was determined by JC-1 staining and quantified by FACS analysis. The experiment was performed in duplicate, and standard deviations were too small to be depicted.
Figure 3.
Figure 3.
Bcl2L12 inhibits post-mitochondrial effector caspase activity. (A,B) Ink4a/Arf-deficient astrocytic cell cultures ectopically expressing pBabe, Bcl2L12V5, and EGFR* were treated with STS (1 μM) for the indicated periods of time and were subjected to Western blot analyses using antibodies specific for the procaspases (A) and active caspases (B). For A, images from two minigels that were blotted onto the same membrane were pasted together: Samples 0, 2, 4, 8, and 16 (pBabe), and 0 and 2 (Bcl2L12) were loaded on one gel, and samples 4, 8, and 16 (Bcl2L12), and 0, 2, 4, 8, and 16 (EGFR*) were loaded on a second gel. We added a dashed line to indicate this. Comparable results were obtained using a STS concentration of 100 nM (data not shown). (C) U87MG cells stably expressing a nontargeting control (shNT) or a Bcl2L12-specific shRNA (shL12-1) were treated with STS (1 μM) for the indicated periods of time, lysed, and subjected to Western blot analysis as in B. (D) Ink4a/Arf-deficient astrocytic cell cultures ectopically expressing pBabe or Bcl2L12V5 were treated with the indicated doses of STS and were assayed for DEVDase activity at 10, 12, 16, and 20 h using an AFC-labeled DEVD peptide. P values were calculated for the 1 μM doses. (E) pBabe- and Bcl2L12-expressing astrocytes were treated with STS (1 μM) for the indicated periods of time and lysed, and active caspases were affinity-labeled with biotinylated VAD-fmk. Streptavidin precipitates were analyzed by Western blot using antibodies specific for active caspase-3 and caspase-7. (F) Lysates from pBabe- and Bcl2L12-expressing astrocyte cultures were activated with dATP (1 mM) and cytochrome c (5 μM), and DEVDase activity was monitored using AFC-labeled DEVD peptide. The p value was calculated for the 60-min time point. Error bars represent standard deviations of replicate data points, and two-tailed p values were calculated using the Student’s t-test.
Figure 4.
Figure 4.
Bcl2L12 promotes necrosis. (A) pBabe- or Bcl2L12-expressing Ink4a/Arf−/− astrocyte cultures were treated with STS (2 μM) for 20 h prior to staining with a combination of Hoechst 33342 and SYTOX Green, a green fluorescent dye staining necrotic cells with a disintegrated plasma membrane. The percentage of the necrotic population was determined by FACS. (B) pBabe- or Bcl2L12-expressing Ink4a/Arf-deficient astrocytes were treated with the indicated amounts of STS, and SYTOX-Green positivity as well as relative LEHDase activity (indicated as relative fluorescence units, RFUs) was assessed. Approximately 100 cells per HPF (total of three HPFs) were counted for each data point and the necrotic index was calculated as the fraction of cells positive for SYTOX green divided by the total number of cells counted. Error bars represent standard deviations of replicate data points, and two-tailed p values were calculated using the Student’s t-test. (C) pBabe- or Bcl2L12-expressing Ink4a/Arf−/− astrocyte cultures were incubated for the indicated periods of time with 1 μM STS, and subjected to anti-HMGB1 staining using a polyclonal anti-HMGB1 antibody. Representative pictures of DAPI, anti-HMGB1, and merged immunofluorescences are shown. White arrowheads point to a secondary necrotic cell. Of note, all HMGB1 immunfluoresence images were taken at the same magnification. The apparent large size of STS-treated Bcl2L12 astrocytes reflects the fact that these cells are necrotic with swollen nuclei and extended cytoplasms. Bar, 15 μm. (D) Quantitation of HMBG1 cytosolic staining of cultures from C over a 24-h period by counting numbers of HMBG1-positive cells per HPF (total of three HPFs counted per time point). Cells with released HMGB1 were divided by the total number of cells counted and expressed as an HMBG1 release index. Error bars represent standard deviations of replicate data points, and two-tailed p values were calculated using the Student’s t-test. (E) pBabe- or Bcl2L12V5-expressing Ink4a/Arf-deficient astrocytes were incubated with STS (1 μM) for the indicated periods of time, and cellular morphology (left) as well as mitochondrial ultrastructure (right) were analyzed by transmission electron microscopy.
Figure 5.
Figure 5.
Bcl2L12 directly interacts with caspase-7 in vitro and in vivo. (A) Anti-L12-2 immunoprecipitates from lysates of LNZ308, U87MG, and 293T cells were subjected to Western blot analysis for procaspase-7 and procaspase-3. For the lysate lane, one-fortieth of the lysate used for the IP was loaded. The asterisk-marked band in the lysates of 293T cells most likely represents an N-terminally truncated caspase-7 enzyme. (B, top) Anti-L12-2 immunoprecipitates from siNT- and siL12-2-transfected U87MG cells with documented knockdown of Bcl2L12 by Western blot were subjected to Western blot analysis for caspase-7. As in A, one-fortieth of the lysate was loaded in the lysate lanes. Hsp70 is shown as a loading control for the Bcl2L12 Western blot. (C) LNZ308 cells were subjected to deconvolution microscopy using the anti-L12-2 antiserum (top row), a monoclonal anti-caspase-7 antibody (left panel, center row), and a monoclonal anti-XIAP antibody (right panel, center row). (Bottom row) Green and red images were overlaid together with DAPI stainings. Bar, 15 μm. (Bottom panel) Deconvoluted images for the Bcl2L12/caspase-7 staining were rotated by 90° along the X-axis to analyze Bcl2L12 and caspase-7 distribution along the Z-axis. Bar, 3 μm. (D) In vitro translated caspase-9 (C-9), caspase-7 (C-7) with a C-terminal His-tag, a mixture of caspase-9 and caspase-7 (C-9 + C-7), and processed caspase-7 (in vitro translated caspase-7 preincubated with 2.8 nM recombinant active caspase-3) were incubated with GST or GST-Bcl2L12 coupled to GSH beads. Precipitates were subjected to SDS-PAGE followed by autoradiography. The migration positions of caspase-7 and of the active caspase-7 subunits are indicated. (FLHis) (His)6-tagged full-length caspase-7; (LS) large subunit; (SS) small subunit; (N pep) N-terminal peptide spanning amino acids 1–23. (E) GST or GST-Bcl2L12 was incubated with increasing amounts of soluble recombinant (His)6-tagged caspase-7, and subjected to SDS-PAGE followed by Coomassie staining or by Western blot analysis using an anti-caspase-7 antibody. (Lanes 13) Due to immediate autoproteolysis of procaspase-7 upon protein induction in bacteria (Stennicke and Salvesen 1999), the proenzyme was nearly completely converted into cleavage intermediates. The migration positions of the caspase-7 species are indicated. (F) Lysates from pBabe- and Bcl2L12-expressing astrocyte cultures were activated with dATP (1 mM) and cytochrome c (5 μM), and the processing of in vitro translated caspase-7 was followed by autoradiography. Of note, an in vitro translated band at ∼32 kDa accumulated in stimulated Bcl2L12 lysates (marked with an asterisk) that could possibly represent ΔN-caspase-7, which has been shown to only have minor catalytic (DEVDase) activity (Denault et al. 2006).

References

    1. Aoyama A., Steiger R.H., Frohli E., Schafer R., von Deimling A., Wiestler O.D., Klemenz R., Steiger R.H., Frohli E., Schafer R., von Deimling A., Wiestler O.D., Klemenz R., Frohli E., Schafer R., von Deimling A., Wiestler O.D., Klemenz R., Schafer R., von Deimling A., Wiestler O.D., Klemenz R., von Deimling A., Wiestler O.D., Klemenz R., Wiestler O.D., Klemenz R., Klemenz R. 1993. Expression of α B-crystallin in human brain tumors. Int. J. Cancer. 1993;55:760–764. - PubMed
    1. Brat D.J., Van Meir E.G., Van Meir E.G. Vaso-occlusive and prothrombotic mechanisms associated with tumor hypoxia, necrosis, and accelerated growth in glioblastoma. Lab. Invest. 2004;84:397–405. - PubMed
    1. Denault J.B., Bekes M., Scott F.L., Sexton K.M., Bogyo M., Salvesen G.S., Bekes M., Scott F.L., Sexton K.M., Bogyo M., Salvesen G.S., Scott F.L., Sexton K.M., Bogyo M., Salvesen G.S., Sexton K.M., Bogyo M., Salvesen G.S., Bogyo M., Salvesen G.S., Salvesen G.S. Engineered hybrid dimers: Tracking the activation pathway of caspase-7. Mol. Cell. 2006;23:523–533. - PubMed
    1. Ferri K.F., Kroemer G., Kroemer G. Mitochondria—The suicide organelles. Bioessays. 2001;23:111–115. - PubMed
    1. Fujita E., Egashira J., Urase K., Kuida K., Momoi T., Egashira J., Urase K., Kuida K., Momoi T., Urase K., Kuida K., Momoi T., Kuida K., Momoi T., Momoi T. Caspase-9 processing by caspase-3 via a feedback amplification loop in vivo. Cell Death Differ. 2001;8:335–344. - PubMed

Publication types

MeSH terms

LinkOut - more resources