Comparative Study
. 2007 Feb;17(2):156-65.
doi: 10.1101/gr.5532707. Epub 2007 Jan 8.

Widespread mRNA polyadenylation events in introns indicate dynamic interplay between polyadenylation and splicing

Affiliations
Comparative Study

Widespread mRNA polyadenylation events in introns indicate dynamic interplay between polyadenylation and splicing

Bin Tian et al. Genome Res. 2007 Feb.

Abstract

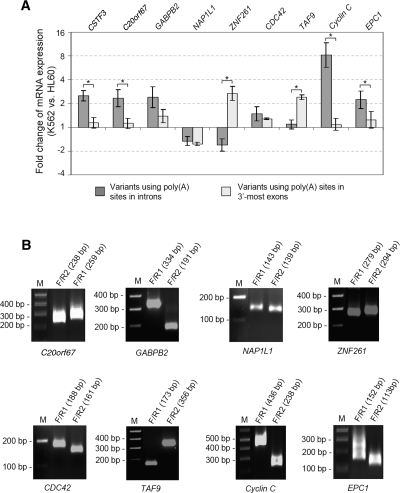
mRNA polyadenylation and pre-mRNA splicing are two essential steps for the maturation of most human mRNAs. Studies have shown that some genes generate mRNA variants involving both alternative polyadenylation and alternative splicing. Polyadenylation in introns can lead to conversion of an internal exon to a 3' terminal exon, which is termed composite terminal exon, or usage of a 3' terminal exon that is otherwise skipped, which is termed skipped terminal exon. Using cDNA/EST and genome sequences, we identified polyadenylation sites in introns for all currently known human genes. We found that approximately 20% human genes have at least one intronic polyadenylation event that can potentially lead to mRNA variants, most of which encode different protein products. The conservation of human intronic poly(A) sites in mouse and rat genomes is lower than that of poly(A) sites in 3'-most exons. Quantitative analysis of a number of mRNA variants generated by intronic poly(A) sites suggests that the intronic polyadenylation activity can vary under different cellular conditions for most genes. Furthermore, we found that weak 5' splice site and large intron size are the determining factors controlling the usage of composite terminal exon poly(A) sites, whereas skipped terminal exon poly(A) sites tend to be associated with strong polyadenylation signals. Thus, our data indicate that dynamic interplay between polyadenylation and splicing leads to widespread polyadenylation in introns and contributes to the complexity of transcriptome in the cell.


Figures

Figure 1.
Figure 1.
Intronic poly(A) sites in human genes. (A) Schematic of poly(A) sites located in different types of exons, i.e., composite terminal exon, skipped terminal exon, and 3′-most exon. 5′ss indicates 5′ splice site; pA, poly(A) site. Exons are shown as boxes. Splicing is indicated by an angled line. (B) Distance between 5′ss and composite exon poly(A) sites. Median values are 295 nt, 355 nt, and 238 nt for poly(A) sites in the conserved set 1, conserved set 2, and nonconserved set, respectively. (C) Distance between 5′ss and skipped exon poly(A) sites. Median values are 3445 nt, 2997 nt, and 2320 nt for poly(A) sites in the conserved set 1, conserved set 2, and nonconserved set, respectively. As indicated, solid black lines are for poly(A) sites in the conserved set 1, dotted black lines are for poly(A) sites in the conserved set 2, and solid gray lines are for poly(A) sites in the nonconserved set.
Figure 2.
Figure 2.
Intronic polyadenylation activity varies between cell lines. (A) QPCR results of nine genes that contain intronic poly(A) sites. For each gene, two sets of primers were used to detect the mRNA variant(s) generated by intronic polyadenylation and the mRNA variant(s) generated by polyadenylation in the 3′-most exon. For each variant type, the mRNA expression level (QPCR value) from K562 cells was compared with that from HL60 cells. For each gene, fold changes of intronic polyadenylation variants and 3′-most exon variants were compared, and those significantly different (P-value < 0.05, t-test) are indicated by asterisks. The result is based on two experiments, each with samples in duplicate. Error bar is SD. (B) PCR products using mRNAs from human K562 cells. M indicates molecular marker; F/R1, products by primers F and R1; and F/R2, products by primers F and R2 (for primer sequences and their targeted regions, see Supplemental Fig. 4). The expected molecular weight based on supporting cDNA/ESTs for each PCR product is indicated above each lane.
Figure 3.
Figure 3.
Characteristics of introns containing composite exon poly(A) sites. (A) Boxplots of 5′ss scores for four groups of introns (left) and a mKS test result (right) comparing introns without poly(A) sites with introns with composite exon poly(A) sites with respect to 5′ss scores. (B) As in A except that 3′ss scores are plotted and compared. (C) As in A except that intron sizes are plotted and compared. For boxplots, median values and P-values from the Wilcoxon tests comparing each group with group 1 are shown. For mKS tests, the E-values are expected values as described in Methods. The E-values for A and B represent the probability of getting smaller values in groups 2 + 3 + 4 than in group 1 by random chance, and the E-value for C represents the probability of getting higher values in groups 2 + 3 + 4 than in group 1 by random chance. In each graph, the black line is the running sum of the real data, and the gray lines are 25 randomly selected running sums from 1000 randomized data. (D) Intron distribution map for introns with composite exon poly(A) sites. x-axis is intron size (i) from small to large, and Y-axis is 5′ss score (j) from low to high, as indicated in the graph. The ratios of observed values to expected ones (Oij/Eij) are shown in a heatmap, where colors are used to represent values according to the color scale under the graph. The row sum ∑20i=1Oij and column sum ∑20j=1Oij are also shown in grayscale bars presented next to and above the graph, respectively, with black representing the highest value and white representing the lowest value.
Figure 4.
Figure 4.
Characteristics of introns containing skipped exon poly(A) sites. (A) Boxplots of 5′ss scores for 4 groups of introns (left) and a mKS test result (right) comparing introns without poly(A) sites with introns with skipped exon poly(A) sites with respect to 5′ss scores. The E-value represents the probability of getting higher values in groups 2 + 3 + 4 than in group 1 by random chance. (B) Schematic of a skipped terminal exon in an intron. (C) Boxplots of 3′ss scores for four groups of introns. Both upstream 3′ss and downstream 3′ss (indicated in B) are shown. (D) Scatterplot of upstream 3′ss scores (x-axis) and downstream 3′ss scores (y-axis). Each dot represents a skipped terminal exon with an upstream 3′ss and a downstream 3′ss for the same 5′ss. Solid squares are for poly(A) sites in the conserved set 1; solid triangles, for poly(A) sites in the conserved set 2; and gray circles, for poly(A) sites in the nonconserved set. (E) Boxplots of intron size for four groups of introns. Both upstream introns and full introns are shown. For boxplots, median values and P-values from the Wilcoxon tests comparing each group with group 1 are shown.
Figure 5.
Figure 5.
PAS hexamer frequency and conservation for different types of poly(A) site. (A) Frequency of four types of PAS hexamers in 10 groups of poly(A) site. Poly(A) site types are indicated at the bottom of the graph. The −40 to −1 nt region was used for identifying PAS hexamers. Other PAS corresponds to any one of the 11 variants of AAUAAA (for details, see Methods), and no PAS indicates that no PAS hexamers can be found in the –40 to –1 nt region. (B) Conservation of PAS type between human and mouse orthologous poly(A) site pairs. Conserved sets were combined for composite exon poly(A) sites and skipped exon poly(A) sites. Each bar represents the percentage of conserved poly(A) sites having a given PAS type (indicated below the bar) in a human poly(A) site group (indicated at the bottom of the graph). Thus, the sum of four bars for a poly(A) site group is one. Each bar contains four areas, representing the frequency of four PAS types for the corresponding mouse sites.

References

    1. Akoulitchev S., Chuikov S., Reinberg D., Chuikov S., Reinberg D., Reinberg D. TFIIH is negatively regulated by cdk8-containing mediator complexes. Nature. 2000;407:102–106. - PubMed
    1. Awasthi S., Alwine J.C., Alwine J.C. Association of polyadenylation cleavage factor I with U1 snRNP. RNA. 2003;9:1400–1409. - PMC - PubMed
    1. Beaudoing E., Freier S., Wyatt J.R., Claverie J.M., Gautheret D., Freier S., Wyatt J.R., Claverie J.M., Gautheret D., Wyatt J.R., Claverie J.M., Gautheret D., Claverie J.M., Gautheret D., Gautheret D. Patterns of variant polyadenylation signal usage in human genes. Genome Res. 2000;10:1001–1010. - PMC - PubMed
    1. Bruce S.R., Dingle R.W., Peterson M.L., Dingle R.W., Peterson M.L., Peterson M.L. B-cell and plasma-cell splicing differences: A potential role in regulated immunoglobulin RNA processing. RNA. 2003;9:1264–1273. - PMC - PubMed
    1. Burge C.B., Tuschl T., Sharp P.A., Tuschl T., Sharp P.A., Sharp P.A. Splicing of precursors to mRNAs by the spliceosomes. In: Gesteland R.F., et al., editors. The RNA world. Cold Spring Harbor Laboratory Press; Cold Spring Harbor, NY: 1999. pp. 525–560.

Publication types