

Estimation of population pharmacokinetic parameters of saquinavir in HIV patients with the MONOLIX software
- PMID: 17211713
- PMCID: PMC1974848
- DOI: 10.1007/s10928-006-9043-z
Estimation of population pharmacokinetic parameters of saquinavir in HIV patients with the MONOLIX software
Abstract
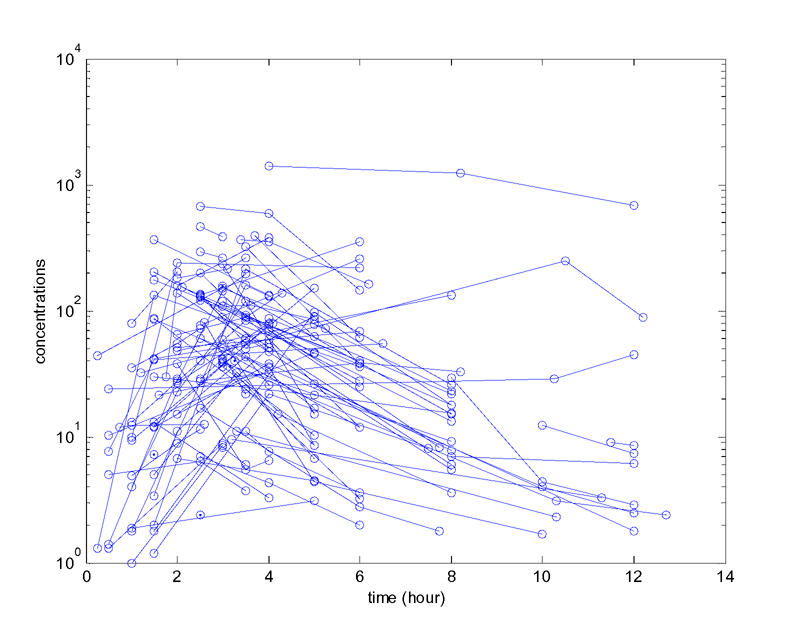
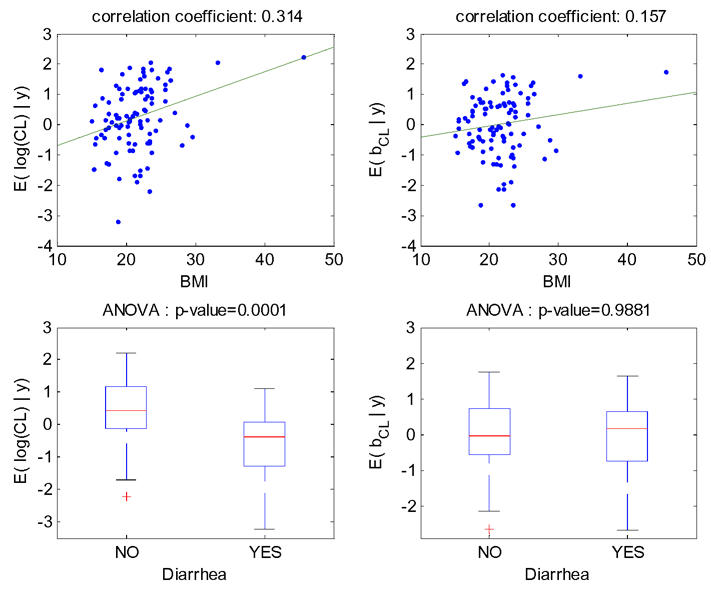
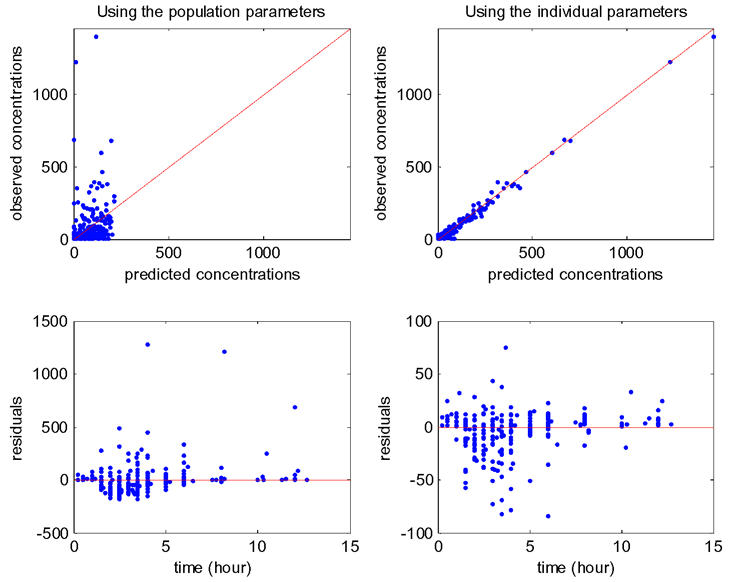
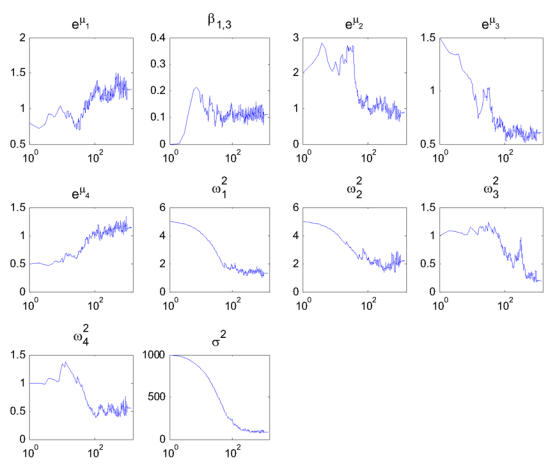
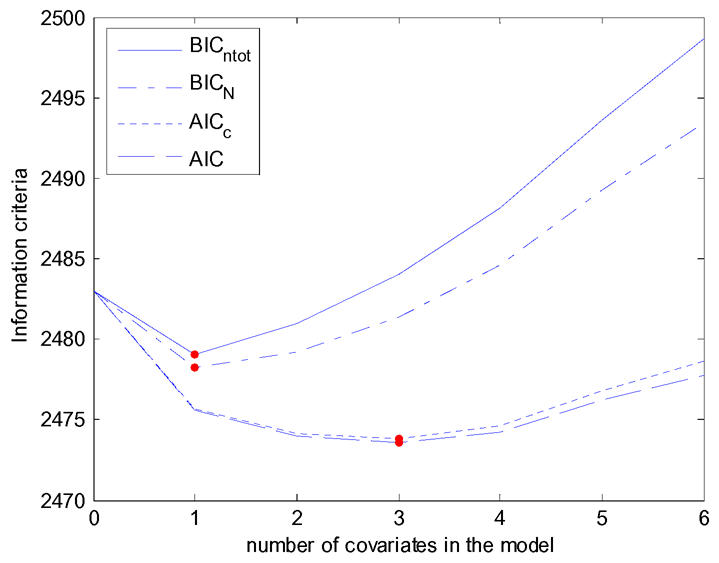
In nonlinear mixed-effects models, estimation methods based on a linearization of the likelihood are widely used although they have several methodological drawbacks. Kuhn and Lavielle (Comput. Statist. Data Anal. 49:1020-1038 (2005)) developed an estimation method which combines the SAEM (Stochastic Approximation EM) algorithm, with a MCMC (Markov Chain Monte Carlo) procedure for maximum likelihood estimation in nonlinear mixed-effects models without linearization. This method is implemented in the Matlab software MONOLIX which is available at http://www.math.u-psud.fr/~lavielle/monolix/logiciels. In this paper we apply MONOLIX to the analysis of the pharmacokinetics of saquinavir, a protease inhibitor, from concentrations measured after single dose administration in 100 HIV patients, some with advance disease. We also illustrate how to use MONOLIX to build the covariate model using the Bayesian Information Criterion. Saquinavir oral clearance (CL/F) was estimated to be 1.26 L/h and to increase with body mass index, the inter-patient variability for CL/F being 120%. Several methodological developments are ongoing to extend SAEM which is a very promising estimation method for population pharmacockinetic/pharmacodynamic analyses.
Figures
Similar articles
-
Fisher information matrix for nonlinear mixed effects multiple response models: evaluation of the appropriateness of the first order linearization using a pharmacokinetic/pharmacodynamic model.Stat Med. 2009 Jun 30;28(14):1940-56. doi: 10.1002/sim.3573. Stat Med. 2009. PMID: 19266541
-
Data cloning: easy maximum likelihood estimation for complex ecological models using Bayesian Markov chain Monte Carlo methods.Ecol Lett. 2007 Jul;10(7):551-63. doi: 10.1111/j.1461-0248.2007.01047.x. Ecol Lett. 2007. PMID: 17542934
-
The SAEM algorithm for group comparison tests in longitudinal data analysis based on non-linear mixed-effects model.Stat Med. 2007 Nov 30;26(27):4860-75. doi: 10.1002/sim.2950. Stat Med. 2007. PMID: 17562540
-
Population kinetics and conditional assessment of the optimal dosage regimen using the P-PHARM software package.Anticancer Res. 1994 Nov-Dec;14(6A):2321-6. Anticancer Res. 1994. PMID: 7825966 Review.
-
Population pharmacokinetics II: estimation methods.Ann Pharmacother. 2004 Nov;38(11):1907-15. doi: 10.1345/aph.1E259. Epub 2004 Sep 14. Ann Pharmacother. 2004. PMID: 15367729 Review.
Cited by
-
Two general methods for population pharmacokinetic modeling: non-parametric adaptive grid and non-parametric Bayesian.J Pharmacokinet Pharmacodyn. 2013 Apr;40(2):189-99. doi: 10.1007/s10928-013-9302-8. Epub 2013 Feb 13. J Pharmacokinet Pharmacodyn. 2013. PMID: 23404393 Free PMC article.
-
Modeling the oxygen uptake kinetics during exercise testing of patients with chronic obstructive pulmonary diseases using nonlinear mixed models.BMC Med Res Methodol. 2016 Jun 1;16:66. doi: 10.1186/s12874-016-0173-8. BMC Med Res Methodol. 2016. PMID: 27245328 Free PMC article.
-
Influence of inoculum size and marbofloxacin plasma exposure on the amplification of resistant subpopulations of Klebsiella pneumoniae in a rat lung infection model.Antimicrob Agents Chemother. 2009 Nov;53(11):4740-8. doi: 10.1128/AAC.00608-09. Epub 2009 Sep 8. Antimicrob Agents Chemother. 2009. PMID: 19738020 Free PMC article.
-
Estimation of apparent clearance of valproic acid in adult Saudi patients.Int J Clin Pharm. 2019 Aug;41(4):1056-1061. doi: 10.1007/s11096-019-00864-w. Epub 2019 Jun 20. Int J Clin Pharm. 2019. PMID: 31222537
-
Quantitative prediction of human pharmacokinetics for mAbs exhibiting target-mediated disposition.AAPS J. 2015 Mar;17(2):389-99. doi: 10.1208/s12248-014-9690-8. Epub 2014 Dec 3. AAPS J. 2015. PMID: 25445845 Free PMC article.
References
-
- Beal SL, Sheiner LB. The NONMEM System. Amer Statist. 1980;34:118–119.
-
- Sheiner LB, Rosenberg B, Marathe VV. Estimation of population characteristics of pharmacokinetic parameters from routine clinical data. J Pharmacokinet Biopharm. 1977;5:445–479. - PubMed
-
- Davidian M, Giltinan DM. Non linear models for repeated measurement data: an overview and update. J Agric Biol Environ Stat. 2003;8:387–419.
-
- Ramos RQ, Pantula SG. Estimation of nonlinear random coefficient models. Statist Probab Letter. 1995;24:49–56.
-
- Vonesh EF. A note on the use of Laplace’s approximation for nonlinear mixed-effects models. Biometrika. 1996;83:447–52.
Publication types
MeSH terms
Substances
LinkOut - more resources
Full Text Sources
Other Literature Sources
Medical
