

Quantitative spatial comparison of diffuse optical imaging with blood oxygen level-dependent and arterial spin labeling-based functional magnetic resonance imaging
- PMID: 17212541
- PMCID: PMC2670188
- DOI: 10.1117/1.2400910
Quantitative spatial comparison of diffuse optical imaging with blood oxygen level-dependent and arterial spin labeling-based functional magnetic resonance imaging
Abstract
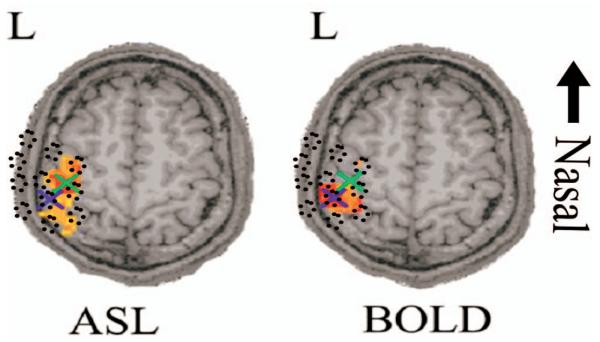
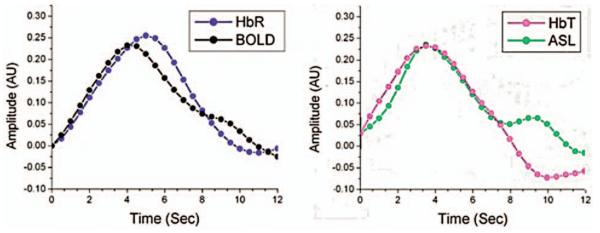
Akin to functional magnetic resonance imaging (fMRI), diffuse optical imaging (DOI) is a noninvasive method for measuring localized changes in hemoglobin levels within the brain. When combined with fMRI methods, multimodality approaches could offer an integrated perspective on the biophysics, anatomy, and physiology underlying each of the imaging modalities. Vital to the correct interpretation of such studies, control experiments to test the consistency of both modalities must be performed. Here, we compare DOI with blood oxygen level-dependent (BOLD) and arterial spin labeling fMRI-based methods in order to explore the spatial agreement of the response amplitudes recorded by these two methods. Rather than creating optical images by regularized, tomographic reconstructions, we project the fMRI image into optical measurement space using the optical forward problem. We report statistically better spatial correlation between the fMRI-BOLD response and the optically measured deoxyhemoglobin (R=0.71, p=1x10(-7)) than between the BOLD and oxyhemoglobin or total hemoglobin measures (R=0.38, p=0.04|0.37, p=0.05, respectively). Similarly, we find that the correlation between the ASL measured blood flow and optically measured total and oxyhemoglobin is stronger (R=0.73, p=5x10(-6) and R=0.71, p=9x10(-6), respectively) than the flow to deoxyhemoglobin spatial correlation (R=0.26, p=0.10).
Figures


Similar articles
-
Detrimental effects of BOLD signal in arterial spin labeling fMRI at high field strength.Magn Reson Med. 2006 Sep;56(3):546-52. doi: 10.1002/mrm.20976. Magn Reson Med. 2006. PMID: 16894581
-
Calibrating the BOLD signal during a motor task using an extended fusion model incorporating DOT, BOLD and ASL data.Neuroimage. 2012 Jul 16;61(4):1268-76. doi: 10.1016/j.neuroimage.2012.04.036. Epub 2012 Apr 23. Neuroimage. 2012. PMID: 22546318 Free PMC article.
-
Investigation of brain hemodynamic changes induced by active and passive movements: a combined arterial spin labeling-BOLD fMRI study.J Magn Reson Imaging. 2014 Oct;40(4):937-48. doi: 10.1002/jmri.24432. Epub 2013 Nov 4. J Magn Reson Imaging. 2014. PMID: 24924449
-
Technical considerations for functional magnetic resonance imaging analysis.Neuroimaging Clin N Am. 2014 Nov;24(4):695-704. doi: 10.1016/j.nic.2014.07.005. Epub 2014 Sep 10. Neuroimaging Clin N Am. 2014. PMID: 25441508 Review.
-
[Innovations in functional MR imaging of the brain: arterial spin labeling and diffusion].J Radiol. 2011 Oct;92(10):878-88. doi: 10.1016/j.jradio.2011.04.016. Epub 2011 Sep 28. J Radiol. 2011. PMID: 22000609 Review. French.
Cited by
-
Study of neurovascular coupling by modulating neuronal activity with GABA.Brain Res. 2011 Feb 4;1372:1-12. doi: 10.1016/j.brainres.2010.11.082. Epub 2010 Dec 8. Brain Res. 2011. PMID: 21145313 Free PMC article.
-
Neuroimaging to detect cortical projection of vestibular response to caloric stimulation in young and older adults using functional near-infrared spectroscopy (fNIRS).Neuroimage. 2013 Aug 1;76:1-10. doi: 10.1016/j.neuroimage.2013.02.061. Epub 2013 Mar 22. Neuroimage. 2013. PMID: 23523804 Free PMC article.
-
Effects of Systemic Physiology on Mapping Resting-State Networks Using Functional Near-Infrared Spectroscopy.Front Neurosci. 2022 Mar 8;16:803297. doi: 10.3389/fnins.2022.803297. eCollection 2022. Front Neurosci. 2022. PMID: 35350556 Free PMC article.
-
Increased Cortical Activity in Novices Compared to Experts During Table Tennis: A Whole-Brain fNIRS Study Using Threshold-Free Cluster Enhancement Analysis.Brain Topogr. 2023 Jul;36(4):500-516. doi: 10.1007/s10548-023-00963-y. Epub 2023 Apr 29. Brain Topogr. 2023. PMID: 37119404 Free PMC article.
-
Direct estimation of evoked hemoglobin changes by multimodality fusion imaging.J Biomed Opt. 2008 Sep-Oct;13(5):054031. doi: 10.1117/1.2976432. J Biomed Opt. 2008. PMID: 19021411 Free PMC article.
References
-
- Villringer APJ, Hock C, Schleinkofer L, Dirnagl U. Near infrared spectroscopy (DOI): A new tool to study hemodynamic changes during activation of brain function in human adults. Neurosci. Lett. 1993;14(1–2):101–104. - PubMed
-
- Hoshi Y, Tamura M. Dynamic multichannel near-infrared optical imaging of human brain activity. J. Appl. Physiol. 1993;75(5):1842–1846. - PubMed
-
- Dunn JF, Zaim-Wadghiri Y, Pogue BW, Kida I. BOLD MRI vs. NIR spectrophotometry. Will the best technique come forward? Adv. Exp. Med. Biol. 1998;454:103–113. - PubMed
-
- Hoge RD, Franceschini MA, Covolan RJM, Huppert T, Mandeville JB, Boas DA. Simultaneous recording of task-induced changes in blood oxygenation, volume, and flow using diffuse optical imaging and arterial spin-labeling MRI. Neuroimage. 2005;25:701–707. - PubMed
-
- Intes X, Maloux C, Guven M, Yazici B, Chance B. Diffuse optical tomography with physiological and spatial a priori constraints. Phys. Med. Biol. 2004;49(12):N1551–N163. - PubMed
Publication types
MeSH terms
Substances
Grants and funding
LinkOut - more resources
Full Text Sources
Medical
