. 2007 May 1;109(9):3803-11.
doi: 10.1182/blood-2006-10-049767. Epub 2007 Jan 9.

Keratinocyte growth factor (KGF) enhances postnatal T-cell development via enhancements in proliferation and function of thymic epithelial cells

Affiliations

Keratinocyte growth factor (KGF) enhances postnatal T-cell development via enhancements in proliferation and function of thymic epithelial cells

Simona W Rossi et al. Blood. .

Abstract

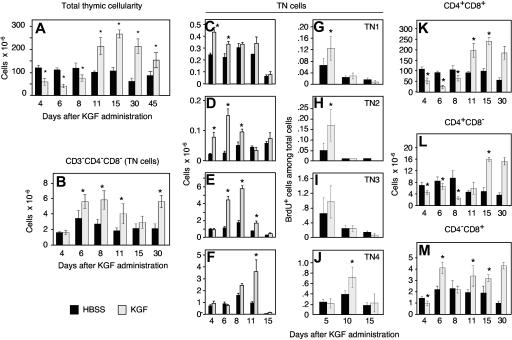
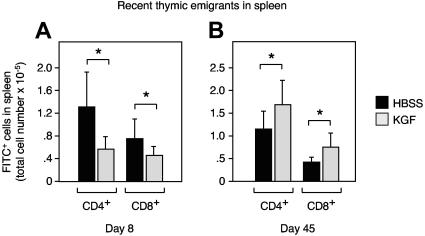
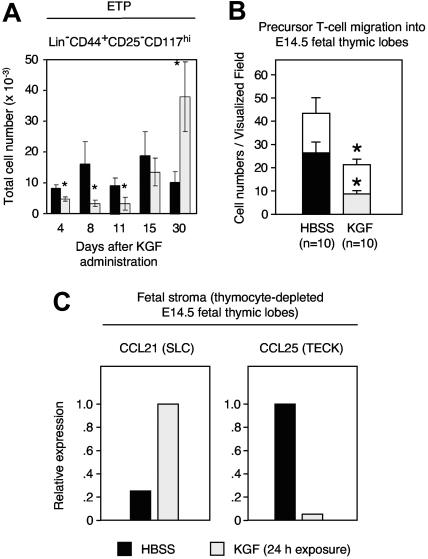
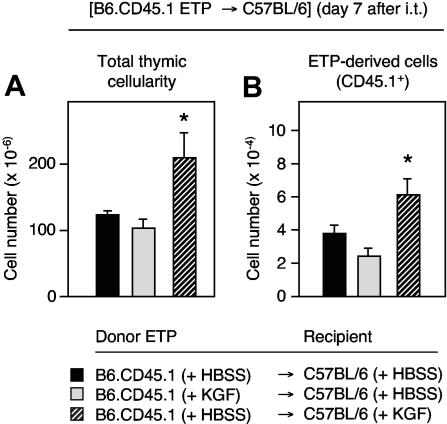
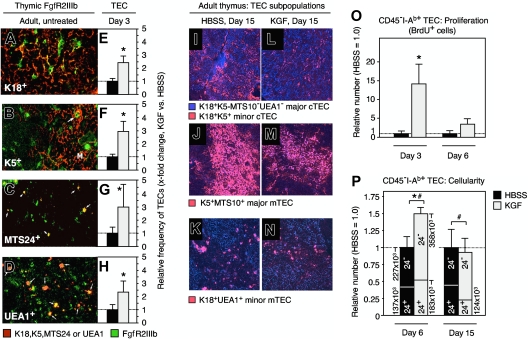
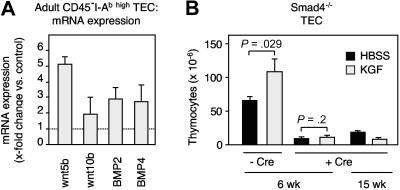
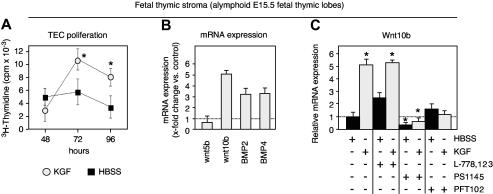
The systemic administration of keratinocyte growth factor (KGF) enhances T-cell lymphopoiesis in normal mice and mice that received a bone marrow transplant. KGF exerts protection to thymic stromal cells from cytoablative conditioning and graft-versus-host disease-induced injury. However, little is known regarding KGF's molecular and cellular mechanisms of action on thymic stromal cells. Here, we report that KGF induces in vivo a transient expansion of both mature and immature thymic epithelial cells (TECs) and promotes the differentiation of the latter type of cells. The increased TEC numbers return within 2 weeks to normal values and the microenvironment displays a normal architectural organization. Stromal changes initiate an expansion of immature thymocytes and permit regular T-cell development at an increased rate and for an extended period of time. KGF signaling in TECs activates both the p53 and NF-kappaB pathways and results in the transcription of several target genes necessary for TEC function and T-cell development, including bone morphogenetic protein 2 (BMP2), BMP4, Wnt5b, and Wnt10b. Signaling via the canonical BMP pathway is critical for the KGF effects. Taken together, these data provide new insights into the mechanism(s) of action of exogenous KGF on TEC function and thymopoiesis.


Figures

Figure 1
Figure 1
KGF increases thymocyte numbers via induction of TN cell division. Adult naive C57BL/6 mice were treated with KGF (5 mg/kg, ▩) or HBSS (■) on 3 consecutive days (days 0, 1, and 2), and thymi were analyzed by flow cytometry at the indicated days. (A) Total thymocyte numbers (cells × 10−6). (B-F) TN cell numbers per thymus (× 10−6). TN indicates CD348; TN1, CD44+CD25; TN2, CD44+CD25+; TN3, CD44CD25+; and TN4, CD44CD25 cells. (G-J) BrdU incorporation into TN cells as a measure of cell division. The data represent the fraction (in %) of cells among total thymocytes that have incorporated BrdU. (K-M) Total numbers per thymus of CD4+CD8+, CD4+CD8, and CD4CD8+ cells. Three independent experiments were performed, and one representative experiment is shown. Mean ± SD; *P < .05 versus HBSS controls, with 5 mice per group and time point.
Figure 2
Figure 2
Thymocyte numbers correlate with T-cell exit into the periphery. Adult C57BL/6 mice were first treated either with KGF (▩) or HBSS (■) as in Figure 1 and then intrathymically injected with FITC (10 μL) 7 or 44 days later. After 24 hours of in vivo labeling, the export of thymus-derived cells into the periphery was assessed by enumeration of FITC-positive cells (× 10−6) on day 8 (A) and day 45 (B). Mean ± SD; *P < .05 versus HBSS controls, with 6 mice per group and time point.
Figure 3
Figure 3
KGF inhibits the capacity of the thymic microenvironment to attract T-cell precursors. (A) Adult C57BL/6 mice were treated either with KGF (▩) or HBSS (■) as in Figure 1, and the numbers of ETPs (LinCD44+CD25CD117hi) were determined at the indicated days. (B) Time-lapse video microscopy recorded E14.5 fetal thymocytes that migrated toward (open bars) and then entered (filled bars) an alymphoid E14.5 fetal thymic lobe that had been pre-exposed for 24 hours to KGF (100 ng/mL, ▩) or HBSS-supplemented medium (■) before the start of the migration experiments. The graph depicts the numbers of cells that migrated in a directed fashion and that reached the thymic lobe. Statistical significance was evaluated individually for open bars (□) and filled bars. (C) Changes in chemokine expression following exposure to exogenous KGF. Chemokine mRNA levels were determined by quantitative reverse-transcription PCR qRT. The y-axis shows the relative transcript levels (the group with maximal chemokine expression was set as 100%, which is displayed as value of 1.0). Mean ± SD; *P < .05 versus HBSS controls in panel A, with 5 mice per group and time point. Mean ± SEM; *P < .01 versus HBSS controls in panel B where data are representative of 10 independent in vitro experiments.
Figure 4
Figure 4
Non–cell-autonomous effect of KGF on early thymic progenitors. ETPs (LinCD44+CD25CD117hi cells) were purified on day 6 after initiation of treatment of B6.CD45.1 donors (CD45.1+) that had received KGF (5 mg/kg per day, ▩) or HBSS (■, ▨) on days 0, 1, and 2. Afterward, ETPs (1 × 10³) from either group were transferred separately to a single thymic lobe of adult C57BL/6 recipients (CD45.2+) that had received 15 days earlier either HBSS (■, ▩) or KGF (5 mg/kg per day, ▨) on 3 consecutive days. The panels depict recipient thymic total cellularity (A) and CD45.1+ congenic ETP progeny (B) that were determined 7 days after intrathymic (i.t.) injection. Mean ± SD; *P < .001 versus HBSS controls (black bars), with 5 mice per group and time point.
Figure 5
Figure 5
KGF enhances TEC numbers via induction of cell division in adult mice. (A-D) Adult TECs express the receptor for KGF. Thymic sections from 6-week-old, naive C57BL/6 mice were analyzed by confocal immunohistofluorescence for the expression of FgfR2IIIb on K18+ epithelial cells (A), K5+ cells (B), MTS24+ cells (C), and on TECs binding UEA1 (D). The colocalization denotes distinct TEC subpopulations expressing the KGF receptor (arrows). A total of 3 experiments were performed, providing comparable results. (E-H) TECs expand in response to KGF in vivo. Adult C57BL/6 mice were treated with KGF (5 mg/kg, ▩) or HBSS (■) on 3 consecutive days (days 0, 1, and 2). Frequencies of the 4 TEC subpopulations were assessed on day 3 by flow cytometry. Relative frequencies are given (x-fold changes KGF vs HBSS treatment, whereby frequencies [in %] for HBSS-treated mice were set as 1.0 and shown as dashed lines). Mean ± SD. *P < .01 versus HBSS. (I-N) KGF administration to adult mice does not alter the normal architecture and epithelial composition of the thymus. Confocal microscopy analysis was performed 15 days after treatment of adult C57BL/6 mice with HBSS (I-K) or KGF (L-N) for 4 TEC subpopulations, as indicated. mTEC indicates medullary TEC; cTEC, cortical TEC. (O) Adult C57BL/6 mice were treated as described in panels E-H and then injected with BrdU 48 and 24 hours before killing. BrdU+ cells among FSChighSSChighCD45I-Ab+ cells present in freshly isolated thymic stromal cells (days 3 and 6) were analyzed (x-fold change KGF vs HBSS, whereby frequencies [in %] in HBSS-treated mice were set as 1.0 [dashed lines]). Mean ± SD; *P < .05 versus HBSS controls, with 6 mice per group and time point. A total of 3 experiments were performed, providing comparable results. (P) Absolute TEC numbers on days 6 and 15 following treatment of mice with either KGF (▩) or HBSS (■). Total CD45I-Ab int+high stromal cells were counted by flow cytometry. Relative frequencies of total TECs are given, whereby the values for HBSS-treated mice were set as 1.0. The fractions of MTS24+ and MTS24 cells (separated by horizontal lines) among total TECs and their absolute cell numbers are also indicated. Mean ± SD; *P < .01, total TEC numbers and #P < .02, total MTS24+ cells, respectively, in KGF-treated mice versus those in HBSS controls. A total of 12 individual mice were analyzed.
Figure 6
Figure 6
Wnts and BMPs are target genes of KGF. (A) Analysis of gene transcription by qRT-PCR in adult TECs. Six-week-old C57BL/6 mice were treated with KGF or HBSS as described in Figure 1 and sorted CD45I-Ab+ TECs were analyzed on day 7 for mRNA expression of Wnt5b, Wnt10b, BMP2, and BMP4. Expression levels in KGF-treated mice (▩) were compared with those in control mice treated with HBSS (x-fold change KGF vs HBSS, whereby the expression levels in the latter were set as 1.0; dotted line). (B) The increase in thymic cellularity in response to KGF depends on signals mediated by Smad4. Adult wild-type B6.129Smad4lox/lox mice (− Cre) and [Smad4lox/lox: Foxn1-cre]F2 mice (+ Cre) were treated with KGF (▩) or HBSS (■). Six and 15 weeks after the initiation of treatment, total thymocyte cellularity was determined. Absolute thymocyte numbers (× 10−6) are shown. Mean ± SD versus HBSS controls. For data shown in panel A, 3 experiments were performed whereby material from 15 mice was pooled for each experiment.
Figure 7
Figure 7
KGF signaling engages NF-κB and p53 in TECs. (A) Proliferation of cells present in thymocyte-depleted E15.5 fetal thymic stromal cell preparations was assessed in culture by 3H-thymidine incorporation (cpm). The x-axis indicates the time (in hours) after exposure to exogenous KGF (100 ng/mL, ○) or HBSS (■); n = 6 experiments. Mean ± SD; *P < .05. (B) Transcripts for Wnt5b, Wnt10b, BMP2, and BMP4 were quantified by qRT-PCR after 24 hours of culture. Expression levels in KGF-treated mice (▩) were compared with those in control mice treated with HBSS (x-fold change KGF vs HBSS, whereby the expression levels in the latter were set as 1.0; dotted line). A total of 3 experiments were performed, whereby material from 15 mice was pooled for each experiment. (C) Transcripts for Wnt10b were quantified by qRT-PCR in alymphoid E15.5 fetal thymic lobes exposed in culture for 24 hours to either KGF (▩) or HBSS (■) in the presence or absence of the following inhibitors: the selective IκB kinase (IKK) inhibitor PS1145, the farnesyltransferase (FTase) inhibitor L-778123, which blocks the Ras pathway, or PFT102, a specific small-molecular inhibitor of p53. Transcription levels were compared with control cultures exposed to HBSS but not supplemented with any of the inhibitors (dotted line = 1.0). Three independent experiments were performed; mean ± SD. *P < .05 versus HBSS control, with 6 lobes examined per time point (A), 3 lobes per group and experiment (B, total of 3 experiments), and 4 experiments (C).

Similar articles

Cited by

References

    1. Mackall CL, Gress RE. Pathways of T-cell regeneration in mice and humans: implications for bone marrow transplantation and immunotherapy. Immunol Rev. 1997;157:61–72. - PubMed
    1. Hakim FT, Gress RE. Reconstitution of thymic function after stem cell transplantation in humans. Curr Opin Hematol. 2002;9:490–496. - PubMed
    1. Van den Brink MR, Alpdogan O, Boyd RL. Strategies to enhance T-cell reconstitution in immunocompromised patients. Nat Rev Immunol. 2004;4:856–867. - PubMed
    1. Fry TJ, Mackall CL. Immune reconstitution following hematopoietic progenitor cell transplantation: challenges for the future. Bone Marrow Transplant. 2005;35(suppl 1):S53–S57. - PubMed
    1. Godthelp BC, van Tol MJ, Vossen JM, van Den Elsen PJ. T-cell immune reconstitution in pediatric leukemia patients after allogeneic bone marrow transplantation with T-cell-depleted or unmanipulated grafts: evaluation of overall and antigen-specific T-cell repertoires. Blood. 1999;94:4358–4369. - PubMed

Publication types

MeSH terms