. 2007 Jan;28(1):116-21.

Apparent diffusion coefficient mapping of salivary gland tumors: prediction of the benignancy and malignancy

Affiliations

Apparent diffusion coefficient mapping of salivary gland tumors: prediction of the benignancy and malignancy

S Eida et al. AJNR Am J Neuroradiol. 2007 Jan.

Abstract

Background and purpose: Preoperative prediction of tumor malignancy is clinically very important, because this information strongly influences the surgical plan. We evaluate the preoperative apparent diffusion coefficient (ADC) maps of benign and malignant salivary gland tumors.

Materials and methods: High-resolution MR imaging was performed on 31 patients with benign or malignant salivary gland tumors; ADC maps of the tumors were also obtained. Surface coils of 47 or 110 mm diameter were used to improve the image resolution. The ADCs were compared with histologic features of the excised tumors.

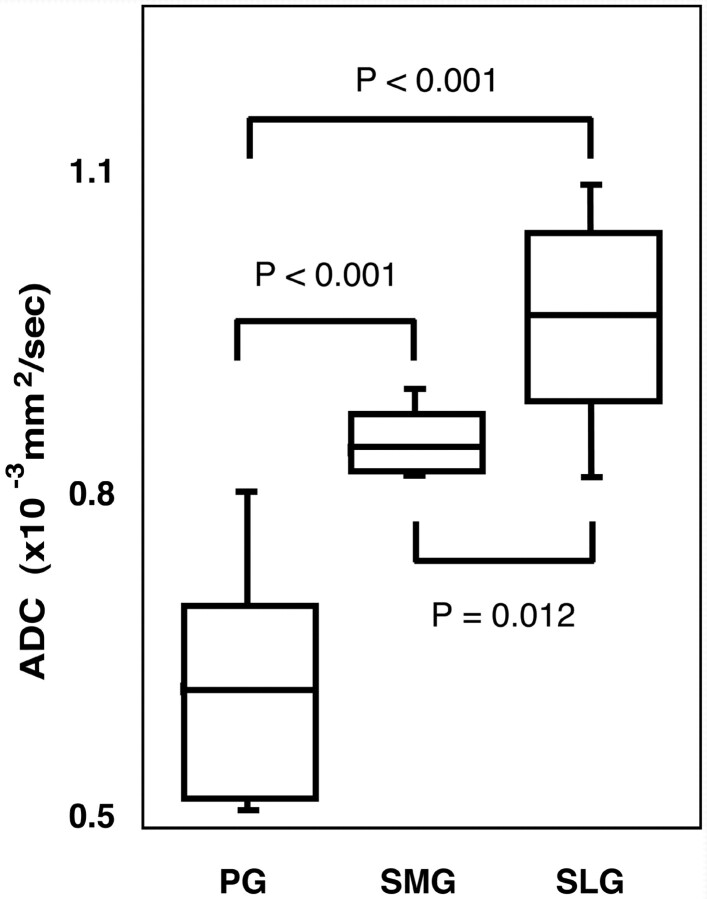
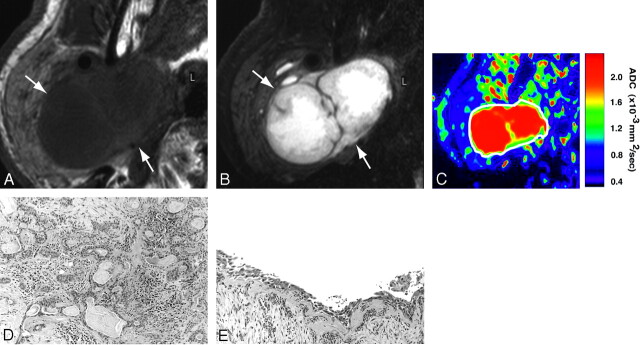
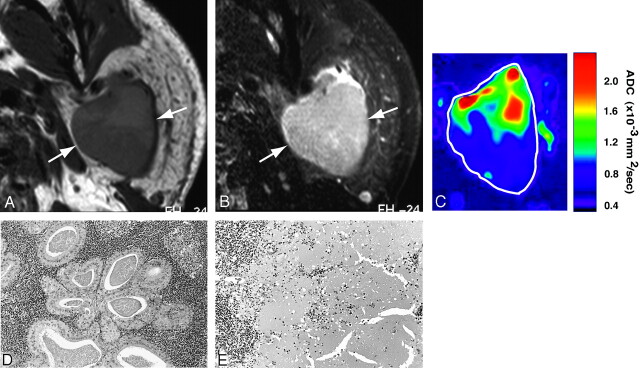
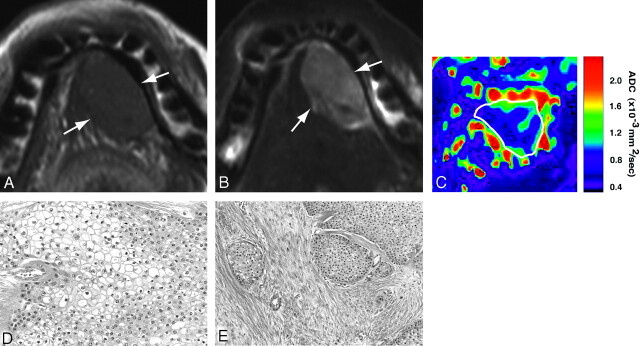
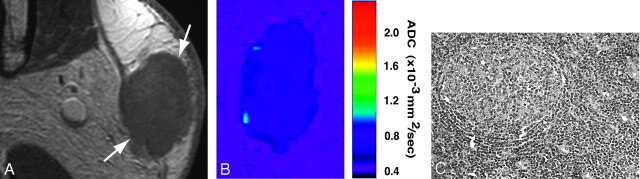
Results: The ADC maps effectively depicted the histologic features of the salivary gland tumors, such as presence of cancer cells, myxomatous tissues, fibrosis, necrosis, cyst formation, and lymphoid tissues. The ADC maps showed that more frequent areas with high ADCs (> or = 1.8 x 10(-3) mm(2)/s) were significantly greater in benign tumors than in malignant tumors. The sensitivity and specificity for high ADC occupying fewer than 5% of the area of a tumor was 89% and 100%, respectively, resulting in 97% accuracy, 100% positive predictive value, and 96% negative predictive value.

Conclusion: The ADC may provide preoperative tissue characterization of the salivary gland tumors.


Figures

Fig 1.
Fig 1.
Differences in ADC levels of the parotid, submandibular, and sublingual glands. Graph (box plots) shows ADC levels of parotid (PG), submandibular (SMG), and sublingual (SLG) glands. The horizontal line in each box is a median (50th percentile) of the measured values, the top and bottom of the boxes represent 25th and 75th percentiles, respectively, and whiskers indicate the range from the largest to smallest observed data points within 1.5 interquartile range presented by the box. P, Mann-Whitney U test.
Fig 2.
Fig 2.
A 70-year-old man with pleomorphic adenoma of parotid gland. A, Axial T1-weighted (TR/TE = 426 ms/12 ms) image using 47-mm microscopy coil shows tumor (arrows) with homogeneous architectures and hypointense signals relative to gland. B, Axial fat-suppressed T2-weighted (TR/TE = 4677 ms/80 ms) image using microscopy coil shows heterogeneous tumor (arrows). C, Axial ADC map shows that tumor (indicated by white contour) contains central high ADC area and peripheral intermediate ADC area. D and E, Photomicrographs show area with proliferating tumor cells (D) or large cyst (E). Original magnifications, 20× (D) and 10× (E). Hematoxylin-eosin staining.
Fig 3.
Fig 3.
A 55-year-old man with Warthin tumor of parotid gland. A, Axial T1-weighted (TR/TE = 426 ms/12 ms) image using 47-mm microscopy coil shows hypointense and homogeneous tumor (arrows). B, Axial fat-suppressed T2-weighted (TR/TE = 4677 ms/80 ms) image using 47-mm microscopy coil shows roughly homogeneous tumor (arrow). C, Axial ADC map shows high ADC areas in proximal half and low ADC areas in distal half of Warthin tumor. D and E, Photomicrographs show lymphoid tumor area (D) and necrotic area (E). Original magnification, 20×. Hematoxylin-eosin staining.
Fig 4.
Fig 4.
A 68-year-old man with mucoepidermoid carcinoma of sublingual gland. A, Axial T1-weighted (TR/TE = 500 ms/15 ms) image using 110-mm surface coil shows homogeneous tumor (arrows) of sublingual gland. B, Axial fat-suppressed T2-weighted (TR/TE = 4677 ms/80 ms) image using 110-mm surface coil shows homogeneous tumor (arrows). C, Axial ADC map shows that major part of tumor is of low ADCs. D and E, Photomicrographs show proliferation of polygonal, clear cancer cells (D) and cancer cell nests in attenuated fibrous connective tissues (E). Original magnifications, 20× (D) and 10× (E). Hematoxylin-eosin staining.
Fig 5.
Fig 5.
A 71-year-old man with adenocarcinoma of submandibular gland. A, Axial T1-weighted (TR/TE = 500 ms/15 ms) image using 110-mm surface coil shows homogeneous tumor (arrows) of submandibular gland. B, Axial fat-suppressed T2-weighted (TR/TE = 4677/80) image using surface coil shows slightly heterogeneous tumor (arrows). C, Axial ADC map shows speckled pattern of low and high ADCs in tumor. D, Photomicrograph shows cancer cells proliferating in loose connective tissues. Original magnification, 20×. Hematoxylin- eosin staining.
Fig 6.
Fig 6.
A 56-year-old woman with malignant lymphoma of parotid gland. A, Axial gadolinium-enhanced fat-suppressed T1-weighted image (TR/TE = 426 ms/12 ms) using 47-mm microscopy coil shows homogeneous lymphoma (arrows) of superficial part of gland. B, Axial ADC map shows lymphoma having low ADCs throughout lesion. C, Photomicrograph shows lymphoma cell proliferation (B cell, medium-sized cell type) associated with germ center-like structure. Original magnification, 20×. Hematoxylin-eosin staining.

References

    1. Freling NJ, Molenaar WM, Vermey A, et al. Malignant parotid tumors: clinical use of MR imaging and histologic correlation. Radiology 1992;185:691–96 - PubMed
    1. Joe VQ, Westesson PL. Tumors of the parotid gland: MR imaging characteristics of various histologic types. AJR Am J Roentgenol 1994;163:433–38 - PubMed
    1. Swartz JD, Rothman MI, Marlowe FI, et al. MR imaging of parotid mass lesions: attempts at histologic differentiation. J Comput Assist Tomogr 1989;13:789–96 - PubMed
    1. Takashima S, Sone S, Takayama F, et al. Assessment of parotid masses: which MR pulse sequences are optimal? Eur J Radiol 1997;24:206–15 - PubMed
    1. Okahara M, Kiyosue H, Hori Y, et al. Parotid tumors: MR imaging with pathological correlation. Eur Radiol 2003;13 Suppl 4:L25–33 - PubMed