Comparative Study
. 2007 Jan 10;27(2):355-65.
doi: 10.1523/JNEUROSCI.3209-06.2006.

A WAVE-1 and WRP signaling complex regulates spine density, synaptic plasticity, and memory

Affiliations
Comparative Study

A WAVE-1 and WRP signaling complex regulates spine density, synaptic plasticity, and memory

Scott H Soderling et al. J Neurosci. .

Abstract

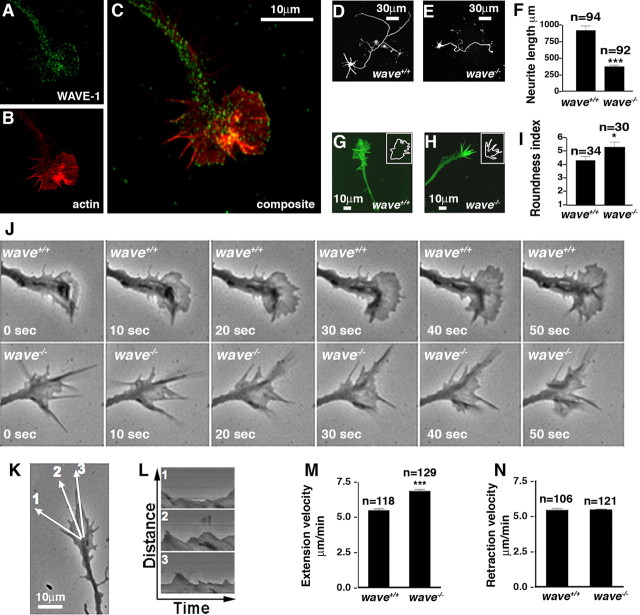
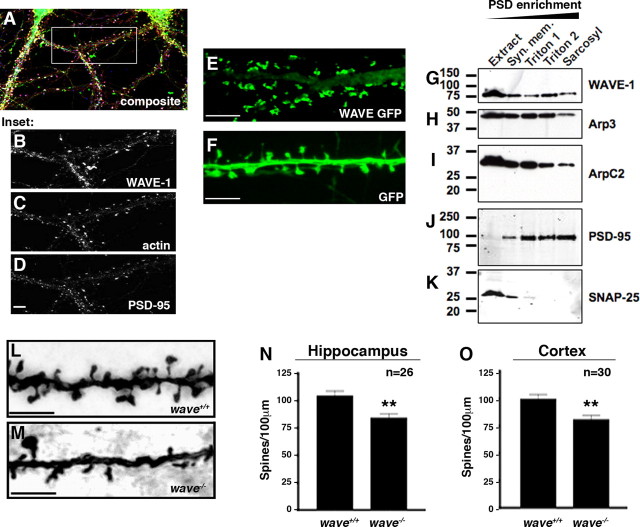
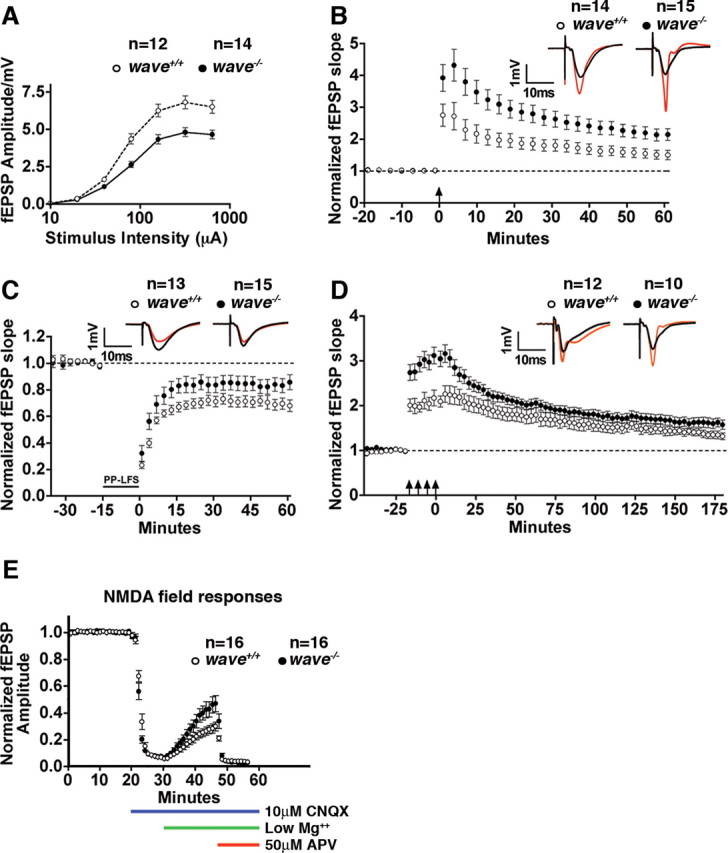
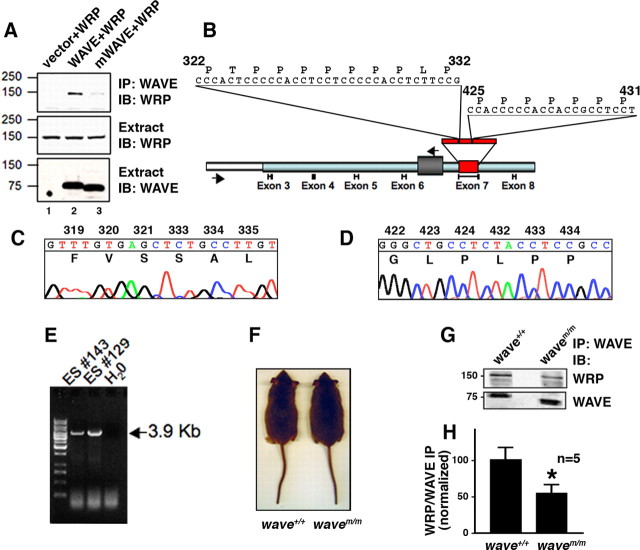
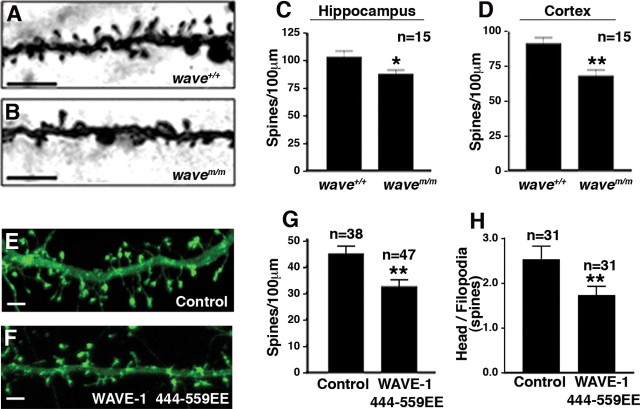
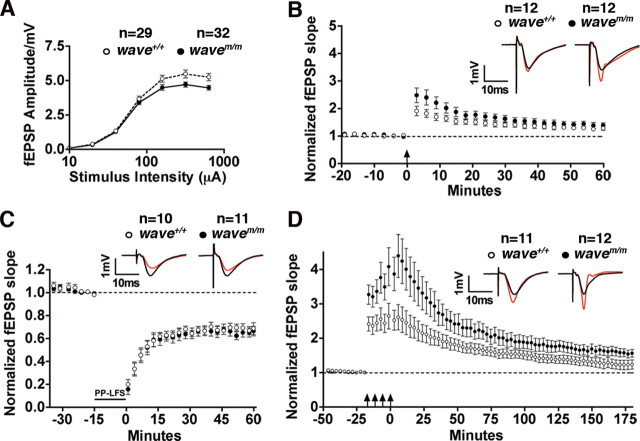
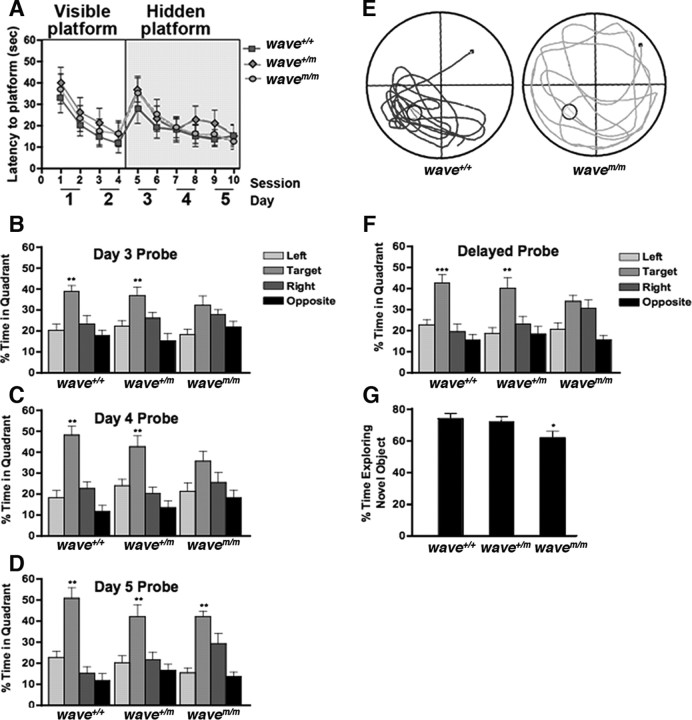
The scaffolding protein WAVE-1 (Wiskott-Aldrich syndrome protein family member 1) directs signals from the GTPase Rac through the Arp2/3 complex to facilitate neuronal actin remodeling. The WAVE-associated GTPase activating protein called WRP is implicated in human mental retardation, and WAVE-1 knock-out mice have altered behavior. Neuronal time-lapse imaging, behavioral analyses, and electrophysiological recordings from genetically modified mice were used to show that WAVE-1 signaling complexes control aspects of neuronal morphogenesis and synaptic plasticity. Gene targeting experiments in mice demonstrate that WRP anchoring to WAVE-1 is a homeostatic mechanism that contributes to neuronal development and the fidelity of synaptic connectivity. This implies that signaling through WAVE-1 complexes is essential for neural plasticity and cognitive behavior.


Figures

Figure 1.
Figure 1.
WAVE-1 participates in growth cone dynamics and neurite outgrowth of cultured hippocampal neurons. A–C, WAVE-1 is found in the growth cones of neonatal mouse cultured hippocampal neurons on day 2 in vitro. A, WAVE-1 immunostaining; B, TRITC–phalloidin-stained F-actin; C, composite of A and B. Hippocampal neurons transfected with GFP from wild-type (D) and WAVE-1 (E) null mice. F, Neurite length (micrometers) was measured on day 5 in vitro, and the neurite outgrowth of wave+/+ (n = 94) and wave−/− (n = 93) neurons was averaged (***p < 0.0001 using two-tailed unpaired t test). Growth cones of wild-type (G) and WAVE-1 (H) null neurons were stained for F-actin with FITC–phalloidin. Insets in G and H are traces of the shape of each growth cone as revealed by fluorescence thresholding. I, Morphology assessment: roundness index was calculated for wave+/+ (n = 34) and wave−/− (n = 30) growth cone shape traces (*p = 0.039 using two-tailed unpaired t test). J, Phase-contrast images of wild-type (top) and WAVE-1 null (bottom) growth cones. Montage shows movement at 10 s intervals. K–N, Kymograph analysis of lamellipodial dynamics from wild-type and WAVE-1 null growth cones. K, Representative image showing three lines of captured pixels from the origin to the periphery of the growth cone. L, Kymograph of lines 1–3 in K showing lamellipodial extension and retraction events. Distance from the origin (y-axis) and time (x-axis) are labeled. The rate of extension and retraction of lamellipodia can be calculated from kymograph data. The extension velocity (M) (wave+/+, n = 118; wave−/−, n = 129) and retraction velocity (N) (wave+/+, n = 106; wave−/−, n = 121) from wild-type and WAVE-1 null growth cones (***p < 0.001 using two-tailed unpaired t test). Data (F, I, M, N) were collected from three independent culture preparations of neurons from each genotype. All data are presented as mean ± SEM.
Figure 2.
Figure 2.
WAVE-1 is localized to spines and regulates spine density. A, Composite image of 21 d in vitro cultured wild-type hippocampal neurons immunostained for WAVE-1 (green), F-actin (red), and PSD-95 (blue) subcellular location. B–D, Enlargement of the inset region shown in A. B, WAVE-1 immunostaining; C, Texas Red–phalloidin staining of F-actin; D, PSD-95 immunostaining. Fluorescence image of a section of dendrite showing the subcellular location of WAVE-1 GFP (E) and GFP control (F) in 21 d in vitro cultured wild-type hippocampal neurons. WAVE-1–GFP is found primarily in spine heads and to a lesser extent in the shaft and dendrite, whereas soluble GFP is more evenly distributed in all of the dendritic structures. G–K, Postsynaptic density enrichment from rat brain extracts. Immunoblot detection of WAVE-1 (G), Arp3 (H), ArpC2 (I), PSD-95 (J), and SNAP-25 (K) in extracts and detergent-soluble PSD fractions. WAVE-1, the Arp2/3 complex subunits Arp3 and ArpC2, and PSD-95 are present within the core PSD (sarcosyl) fraction. The presynaptic protein SNAP-25 is present in the synaptic membrane fraction (Syn. mem.). L–O, Golgi-impregnated hippocampal sections show dendritic spines in neurons from wild-type (L) and WAVE-1 (M) null mice. Quantification of spine density (spines/100 μm) in dendritic segments from the hippocampus (N) (area CA1; n = 26; **p = 0.0026 using two-tailed unpaired t test) and cortex (O) (layer 1; n = 30; **p = 0.0027 using two-tailed unpaired t test).
Figure 3.
Figure 3.
WAVE-1 regulates synaptic plasticity. Electrophysiological analysis of hippocampal slices from wild type (wave+/+) and WAVE-1 null (wave−/−) mice. A, Graph depicting the synaptic input–output relationship (semi-log scale). Data represent mean ± SEM; n values are shown. B, Graph comparing LTP induced by three trains of theta-burst stimulation [arrow; 4 pulses/burst (100 Hz), 5 bursts/train (5 Hz), 3 trains (20 s apart)]. Representative traces before (black) and 60 min after (red) induction of LTP. Data represent mean ± SEM; n values are shown. C, Graph comparing LTD induced by low-frequency paired-pulse stimulation [900 paired pulses (50 ms ISI) delivered at 1 Hz]. Representative traces before (black) and 60 min after (red) induction of LTD. Data represent mean ± SEM; n values are shown. D, Graph comparing L-LTP induced by four epochs of theta-burst trains [arrows; 4 pulses/burst (100Hz), 5 bursts/train (5 Hz), 3 trains (20 s apart), 4 epochs (at 5 min intervals)]. Representative traces before (black) and 180 min after (red) induction of LTP. Data represent mean ± SEM; n values are shown. E, Graph comparing normalized NMDAR field responses induced by Schaffer collateral stimulation at basal intensity in the presence of CNQX/low Mg2+ (see Materials and Methods). Data represent mean ± SEM; n values are shown.
Figure 4.
Figure 4.
wavem/m mice lack WRP binding sites and exhibit reduced WRP association in vivo. A, Western blot analysis of WRP in WAVE-1 immunoprecipitations (IP) from HEK-293 extracts expressing WRP alone, WRP and WAVE-1, or WRP and WAVE-1 lacking amino acids 322–332 and 425–431 (mWAVE). Immunoblots (IB) detecting WRP in WAVE immunoprecipitations (top), WRP in total extracts (middle), and WAVE in total extracts (bottom). B, Schematic of targeting construct used to introduce mWAVE mutations into the WAVE-1 locus. Relative positions of exons are indicated below. Light blue box indicates genomic region used in targeting construct, and white-boxed region represents flanking genomic sequence outside of the targeting construct. Gray box between exon 6 and exon 7 indicates insertion of neomycin resistance, and red box represents exon 7 in which the mutations were introduced. Arrows indicate position of primers used to screen embryonic stem cells for homologous recombination. Sequence above exon 7 represents the sequences deleted. C, D, Chromatogram of sequence data from targeted embryonic stem cells demonstrating the sequence deletions from homologous recombination. Amino acid sequence and residue number are indicated above the nucleotide sequence. E, Agarose gel of embryonic stem cell PCR screen for homologous recombination. Two positive lines, ES #143 and ES #129, are indicated along with a negative control (H2O). F, Wild-type (wave+/+) and knock-in (wavem/m) mice at 14 weeks of age. G, WAVE-1 immunoprecipitations from brain extracts of wild-type versus knock-in mice. Top is an immunoblot of coprecipitated WRP. Bottom is an immunoblot of WAVE-1. H, Quantitation of the amount of WRP coprecipitated with either WAVE or mWAVE from wild-type or knock-in brain extracts. Ratio is the amount of WRP divided by the amount of WAVE present in each immunoprecipitation (n = 5; *p = 0.036 using one-tailed unpaired t test).
Figure 5.
Figure 5.
Anchored WRP regulates spine density via WAVE-1 and Arp2/3. Hippocampal sections of wild-type (A) and mWAVE knock-in (B) mice after Golgi impregnation show dendritic segments of neurons. Quantitation of spine density (spines/100 μm) from hippocampus (C; area CA1) (*p = 0.0375 using two-tailed unpaired t test) and cortex (D; layer 1) (**p = 0.0015 using two-tailed unpaired t test). E, F, Fluorescence image of a section of dendrite showing the spine density in cultured hippocampal neurons expressing either YFP–actin (E) or WAVE-1 444–559EE and YFP–actin (F). G, Quantification of spine density (spines/100 μm) (**p = 0.0027 using two-tailed unpaired t test). H, Quantification of spine morphology (ratio of spines with heads/filopodial spines) (**p = 0.033 using two-tailed unpaired t test). All data are presented as mean ± SEM. Scale bars, 5 μm.
Figure 6.
Figure 6.
Enhanced L-LTP in the wavem/m mice. A–D, Electrophysiological analysis of hippocampal slices from wild-type and mWAVE knock-in mice. A, Graph comparing the synaptic input–output relationship over a range of stimulus intensity (semi-log scale). Data represent mean ± SEM; n values are indicated. B, Graph comparing LTP induced by three trains of theta-burst stimulation [arrow; 4 pulses/burst (100 Hz), 5 bursts/train (5 Hz), 3 trains (20 s apart)]. Representative traces before (black) and 60 min after (red) induction of LTP. Data represent mean ± SEM; n values are indicated. C, Graph comparing LTD induced by low-frequency paired-pulse stimulation [900 paired pulses (50 ms ISI) delivered at 1 Hz]. Representative traces before (black) and 60 min after (red) induction of LTD. Data represent mean ± SEM; n values are indicated. D, Graph comparing L-LTP induced by four epochs of theta-burst trains [arrows; 4 pulses/burst (100Hz), 5 bursts/train (5 Hz), 4 trains (5 min apart)]. Representative traces before (black) and 180 min after (red) induction of LTP. Data represent mean ± SEM; n values are indicated.
Figure 7.
Figure 7.
Disruption of WRP anchoring to WAVE affects memory retention. A–F, Analysis of spatial learning and memory performance of wild-type (wave+/+), heterozygous (wave+/m), and knock-in (wavem/m) mice in the Morris water maze (n = 10 each genotype; mean ± SEM value is shown). A, Time to swim to the platform (latency) was measured for wild-type (squares), heterozygous (diamonds), and knock-in (circles) mice. The mice were tested in two daily sessions of three trials each. Sessions 1–4 are learning trials for the visible platform, and sessions 5–10 are learning trials for the hidden (submerged) platform. No significant differences were observed in the learning curves. B–F, Memory retention after learning trials was measured in probe trials (platform removed). The percentage of time spent searching in the target quadrant (quadrant containing platform during sessions 5–10) versus nontarget quadrants was measured. **p < 0.01 target versus any other quadrant using one-way ANOVA. Probe trials were conducted 2 h after session 6 on day 3 (B) (wave+/+, p = 0.0012; wave+/m, p = 0.0035), session 8 on day 4 (C) (wave+/+, p < 0.0001; wave+/m, p < 0.0004), and session 10 on day 5 (D) (wave+/+, p < 0.0001; wave+/m, p = 0.0026; wavem/m, p < 0.0001). E, F, A delayed probe trial was conducted 14 d after session 10 to measure long-term memory retention. E, Representative swim-trace patterns for wild-type (wave+/+, left) and knock-in (wavem/m, right) mice in the delayed probe trial. Start position is marked by a black square, and a circle marks target location. F, Quantification of percentage time spent searching in each quadrant during the delayed probe trial (wave+/+, ***p < 0.0001; wave+/m, **p = 0.005). G, Nonspatial learning and memory was measured by novel-object recognition (n = 10 each genotype; mean ± SEM value is shown). Graph shows percentage time spent exploring the novel object for wild-type (wave+/+), heterozygous (wave+/m), and knock-in (wavem/m) mice. *p = 0.036 using one-way ANOVA; Tukey–Kramer, p < 0.05 wild-type versus knock-in.

References

    1. Allen KM, Gleeson JG, Bagrodia S, Partington MW, MacMillan JC, Cerione RA, Mulley JC, Walsh CA. PAK3 mutation in nonsyndromic X-linked mental retardation. Nat Genet. 1998;20:25–30. - PubMed
    1. Angeloni D, Lindor NM, Pack S, Latif F, Wei MH, Lerman MI. CALL gene is haploinsufficient in a 3p- syndrome patient. Am J Med Genet. 1999;86:482–485. - PubMed
    1. Banker GA. Culturing nerve cells. Ed 2. Cambridge, MA: MIT; 1998.
    1. Bear JE, Rawls JF, Saxe CL., III SCAR, a WASP-related protein, isolated as a suppressor of receptor defects in late Dictyostelium development. J Cell Biol. 1998;142:1325–1335. - PMC - PubMed
    1. Bear JE, Loureiro JJ, Libova I, Fassler R, Wehland J, Gertler FB. Negative regulation of fibroblast motility by Ena/VASP proteins Cell. 2000;101:717–728. - PubMed

Publication types

MeSH terms

Substances