. 2007 Jan 11;445(7124):214-8.
doi: 10.1038/nature05458.

Histone arginine methylation regulates pluripotency in the early mouse embryo

Affiliations

Histone arginine methylation regulates pluripotency in the early mouse embryo

Maria-Elena Torres-Padilla et al. Nature. .

Abstract

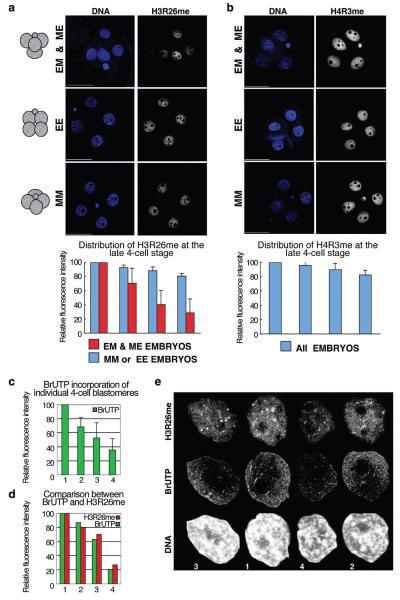
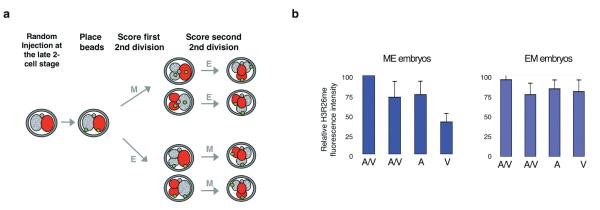
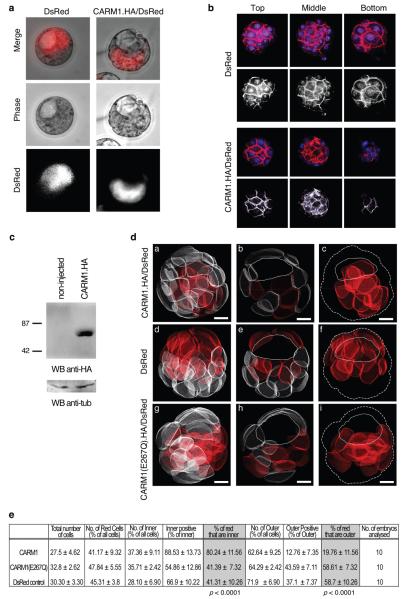
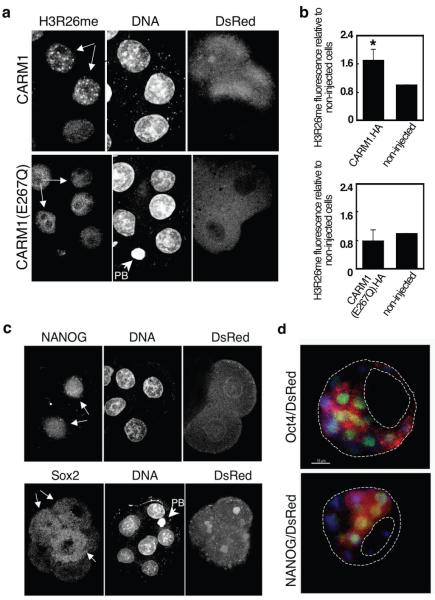
It has been generally accepted that the mammalian embryo starts its development with all cells identical, and only when inside and outside cells form do differences between cells first emerge. However, recent findings show that cells in the mouse embryo can differ in their developmental fate and potency as early as the four-cell stage. These differences depend on the orientation and order of the cleavage divisions that generated them. Because epigenetic marks are suggested to be involved in sustaining pluripotency, we considered that such developmental properties might be achieved through epigenetic mechanisms. Here we show that modification of histone H3, through the methylation of specific arginine residues, is correlated with cell fate and potency. Levels of H3 methylation at specific arginine residues are maximal in four-cell blastomeres that will contribute to the inner cell mass (ICM) and polar trophectoderm and undertake full development when combined together in chimaeras. Arginine methylation of H3 is minimal in cells whose progeny contributes more to the mural trophectoderm and that show compromised development when combined in chimaeras. This suggests that higher levels of H3 arginine methylation predispose blastomeres to contribute to the pluripotent cells of the ICM. We confirm this prediction by overexpressing the H3-specific arginine methyltransferase CARM1 in individual blastomeres and show that this directs their progeny to the ICM and results in a dramatic upregulation of Nanog and Sox2. Thus, our results identify specific histone modifications as the earliest known epigenetic marker contributing to development of ICM and show that manipulation of epigenetic information influences cell fate determination.


Figures

Figure 1
Figure 1
Levels of H3R26me are different in blastomeres of 4-cell stage embryos and correlate with their spatial arrangement. (a) 4-cell stage embryos were stained for H3R26me and grouped according to their shape in tetrahedral (EM and ME), EE (flatten,polar body on one side) or MM (flatten,polar body in the middle). Shown are projections, including all sections, of representative embryos.Fluorescence levels were quantified and normalised against the blastomere showing the highest level which was set at 100%. Decreasing values of fluorescence were normalised and averaged accordingly(n=18). Each bar represents the relative fluorescence level of each of the 4 blastomeres. Scale bar 50μm. (b) Differences in histone arginine methylation levels in 4-cell stage blastomeres are specific:only residues that are CARM1 targets, and not PRMT1, display differential distribution. (c) 4-cell stage blastomeres display different global transcriptional activity. BrUTP incorporation was measured in sections from nuclei of 4-cell stage embryos captured every 0.6μm (n=12). Projections were used after cropping off the nuclei using the Volocity software to quantify active (nuclear) transcription. Values were normalised as in (a). (d-e) Global transcription levels correlate with global H3R26me levels. Quantification (d) of BrUTP incorporation (green) and H3R26me (red) of 4-nuclei of a representative embryo. Nuclei (e) are shown at the same scale,numbers at the bottom correspond to the blastomere numbers of the graph.
Figure 2
Figure 2
The ‘vegetal’ blastomere in ME embryos displays the lowest levels of H3R26me. (a) Design to determine the identity of 4-cell-stage blastomeres according to division orientation, order, and blastomere positioning. A 2-cell stage blastomere was microinjected with rhodamine-dextran. We then placed a green fluorescent bead in the ‘vegetal’ membrane of the two blastomeres. Divisions were scored and embryos were stained for H3R26me at the late 4-cell stage.The position of the bead and the presence of rhodamine allowed identification of the blastomeres as Animal/Vegetal (A/V,derived from M divisions), Animal or Vegetal (A or V,derived from E divisions) in EM(n=10) or ME(n=9) embryos. (b) The vegetal blastomere of ME embryos displays the lowest levels of H3R26me while the vegetal blastomere of EM embryos displays similar levels to the animal or animal/vegetal blastomeres. H3R26me levels were quantified as in Fig.1.
Figure 3
Figure 3
CARM1 overexpression in a 2-cell blastomere results in the contribution of that cell predominantly to the ICM. A late 2-cell stage blastomere was injected with mRNA for DsRed alone (control) or in combination with mRNA for CARM1.HA. This results in CARM1 overexpression from the mid 4-cell stage since CARM1.HA/DsRed expression starts 6-8h after injection (not shown). Embryos were cultured until the blastocyst stage and observed under fluorescence microscopy. DsRed was used as a lineage tracer. (a) Representative embryos derived from DsRed only (n=17) or DsRed/CARM1.HA-overexpression experiments (n=35). (b) Blastocysts were stained with phallaoidin-Texas-Red and TOTO-3 (to visualize cell membranes and DNA, respectively) and analysed under confocal microscopy. Representative top, middle and bottom sections are shown. DNA is in blue; Phallaoidin (red) can be distinguished from DsRed because the latter is exclusively cytoplasmic. The red channel is shown as grayscale. The progeny of the CARM1-overexpressing blastomere is predominantly within the inner cells of the blastocyst. (c) Overexpression of CARM1 was verified by Western blot in zygotes injected with mRNA for CARM1.HA/DsRed. (d) Representative 3D reconstructions of blastocysts in which mRNA for CARM1.HA/DsRed (a), Ds/Red only (d), or CARM1(E267Q).HA/DsRed (g) was microinjected at the 2-cell stage. Blastocysts were stained as in (b). Confocal z-stacks were taken at 1μm intervals. IMARIS software was used to outline cell membranes to create 3D models of all cells of the embryo. Cells were then scored according to their position: cells completely surrounded by others are denoted as inner, those with an outer surface as outer. Cells were scored as either positive or negative for DsRed. Progeny of injected blastomere is shown in red. A middle slice is shown in b,e, h where the cavity is depicted with a line. In c,f ,i, only the progeny of the injected blastomere is shown, the contour of the embryo is indicated by a dashed line and the position of the cavity by a solid line. Scale bar 10μm.
Figure 4
Figure 4
Overexpression of CARM1 results in elevated levels of arginine methylation and upregulation of Nanog and Sox2. (a-b) A 2-cell stage blastomere was injected with mRNA for CARM1.HA/DsRed. Embryos were cultured to the 8-cell stage and stained for H3R26me. Shown are 3 nuclei of cells from a representative embryo. The progeny of the injected blastomere is indicated by arrows (note the presence of DsRed). In (b) H3R26me levels in cells overexpressing CARM1 were normalised against those of non-injected cells within the same embryo (*p=0.0006)(n=14). In the bottom, data derived from overexpression of CARM1(E267Q).HA. Here, 5 cells from the same embryo are shown(n=6). PB:polar body. (c) Embryos were injected as in (a) and stained with a NANOG (n=5) or a Sox2 (n=11) antibody between the 6- and 8-cell stage. For NANOG, 4 nuclei of the same embryo, two of them deriving from the CARM1-overexpressing blastomere are shown(white arrows, note the presence of DsRed). NANOG is detectable only in the blastomeres deriving from the 2-cell stage blastomere injected with CARM1 mRNA. For Sox2, a representative embryo is shown. Note that Sox2 is mainly cytoplasmic at this stage. We were unable to address CARM1 function by the converse experiment by RNAi since the protein is provided maternally and its mRNA is rapidly downregulated after fertilization. However, treatment of zygotes with specific arginine methyltransferase inhibitors showed that reducing levels of histone arginine methylation impaired development (Supplementary Figure S8). (d) The progeny of CARM1-overexpressing blastomere expresses ICM markers in the blastocyst. Blastocysts were stained for Oct4/Pou5f1 (n=7) or NANOG (n=3)(green). The presence of DsRed indicates the progeny of the injected blastomere. DNA shown in blue.

Comment in

Similar articles

Cited by

References

    1. Piotrowska K, Wianny F, Pedersen RA, Zernicka-Goetz M. Blastomeres arising from the first cleavage division have distinguishable fates in normal mouse development. Development. 2001;128:3739–48. - PubMed
    1. Piotrowska-Nitsche K, Perea-Gomez A, Haraguchi S, Zernicka-Goetz M. Four-cell stage mouse blastomeres have different developmental properties. Development. 2005;132:479–90. - PubMed
    1. Gardner RL. Specification of embryonic axes begins before cleavage in normal mouse development. Development. 2001;128:839–47. - PubMed
    1. Fujimori T, Kurotaki Y, Miyazaki J, Nabeshima Y. Analysis of cell lineage in two- and four-cell mouse embryos. Development. 2003;130:5113–22. - PubMed
    1. Piotrowska-Nitsche K, Zernicka-Goetz M. Spatial arrangement of individual 4-cell stage blastomeres and the order in which they are generated correlate with blastocyst pattern in the mouse embryo. Mech Dev. 2005;122:487–500. - PubMed

Publication types

MeSH terms