. 2007 Jan 24;26(2):516-26.
doi: 10.1038/sj.emboj.7601509. Epub 2007 Jan 11.

ZAP-70 kinase regulates HIV cell-to-cell spread and virological synapse formation

Affiliations

ZAP-70 kinase regulates HIV cell-to-cell spread and virological synapse formation

Nathalie Sol-Foulon et al. EMBO J. .

Abstract

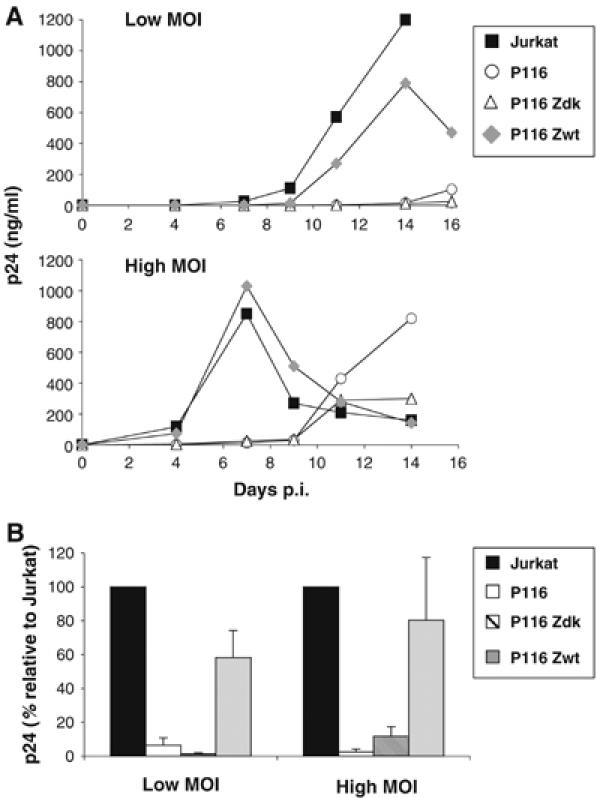
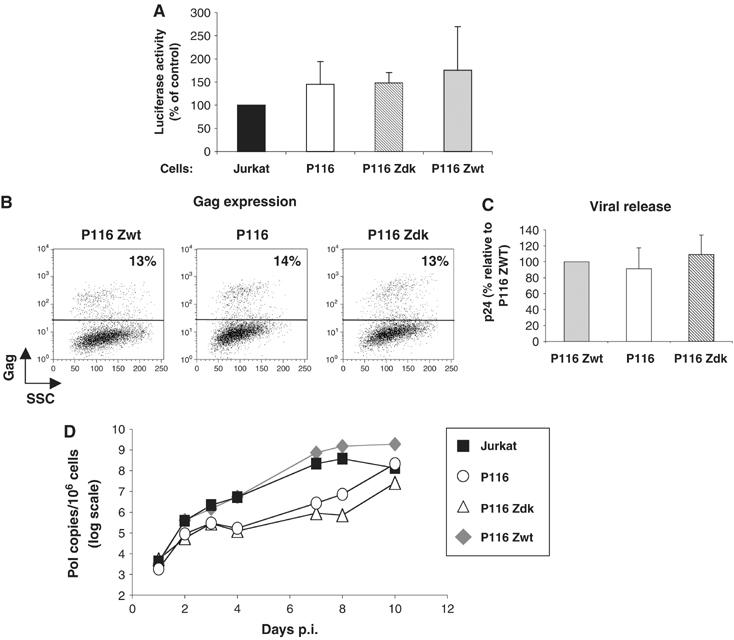
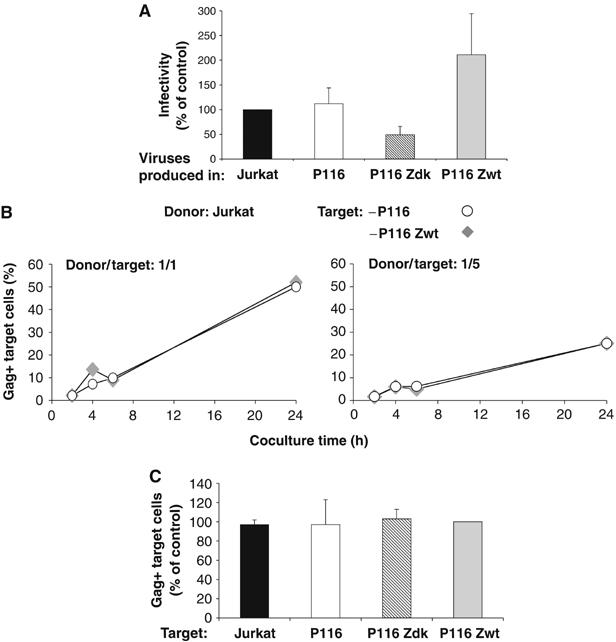
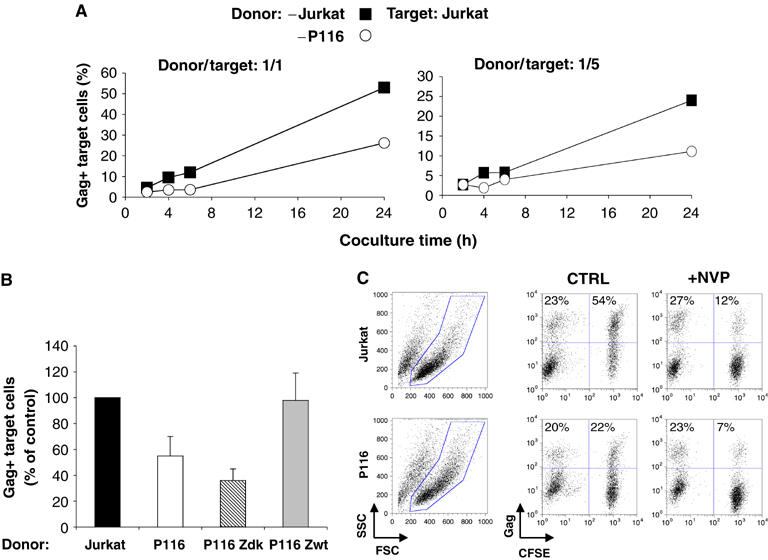
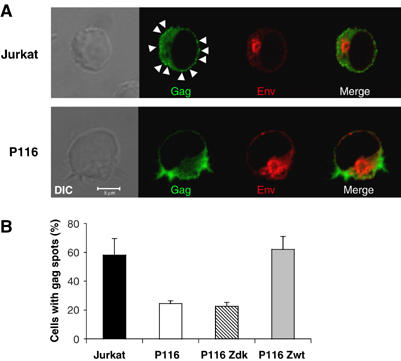
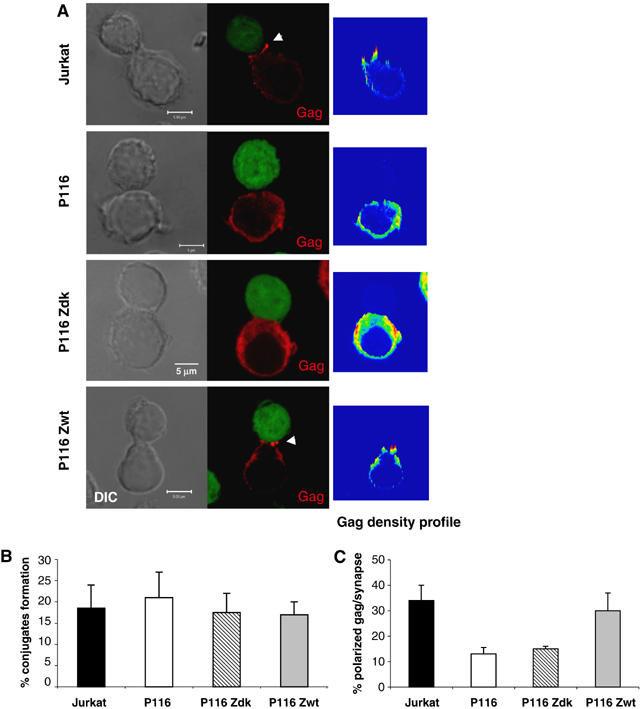
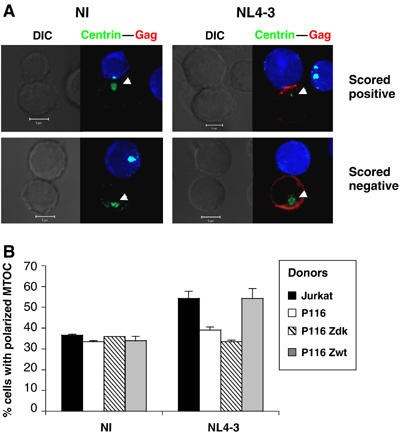
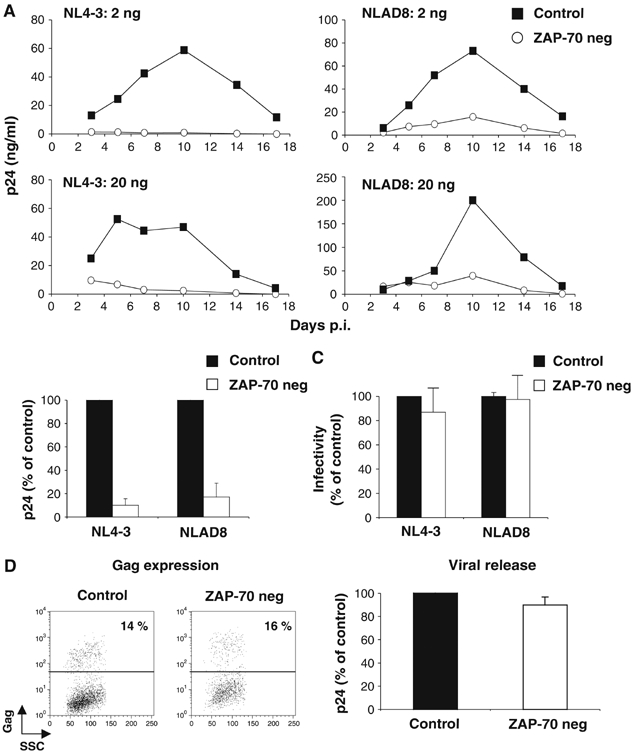
HIV efficiently spreads in lymphocytes, likely through virological synapses (VSs). These cell-cell junctions share some characteristics with immunological synapses, but cellular proteins required for their constitution remain poorly characterized. We have examined here the role of ZAP-70, a key kinase regulating T-cell activation and immunological synapse formation, in HIV replication. In lymphocytes deficient for ZAP-70, or expressing a kinase-dead mutant of the protein, HIV replication was strikingly delayed. We have characterized further this replication defect. ZAP-70 was dispensable for the early steps of viral cycle, from entry to expression of viral proteins. However, in the absence of ZAP-70, intracellular Gag localization was impaired. ZAP-70 was required in infected donor cells for efficient cell-to-cell HIV transmission to recipients and for formation of VSs. These results bring novel insights into the links that exist between T-cell activation and HIV spread, and suggest that HIV usurps components of the immunological synapse machinery to ensure its own spread through cell-to-cell contacts.


Figures

Figure 1
Figure 1
HIV replication is impaired in ZAP-70-defective Jurkat cells. (A) Kinetic analysis. Jurkat (ZAP-70+), P116 (ZAP-70−) and P116 clones reconstituted with either a wild type or a kinase-dead mutant of ZAP-70 (P116 Zwt and P116 Zdk) were exposed to the indicated HIV-1 (NL4-3 strain) inocula (0.02 and 2 ng p24/106 cells/ml). Viral replication was followed by measuring p24 release in cell supernatants, at the indicated days p.i. Data are representative of four independent experiments. (B) Viral production at the peak. A mean±s.d. of four independent experiments is depicted, with 100% corresponding to p24 values obtained in Jurkat cells at the peak (days 6–8 and 14 for the high and low MOI, respectively). With other cell clones, the % values were calculated with p24 values obtained the same day p.i. Low and high MOI corresponded to 0.02–1 and 2–10 ng p24/106 cells/ml, respectively.
Figure 2
Figure 2
Early steps of the viral cycle and proviral DNA synthesis in ZAP-70-defective cells. (A, B) Replication of single-cycle HIV. (A) Jurkat clones were infected with single-cycle HIV, pseudotyped with X4 envelope glycoproteins, and expressing luciferase reporter protein (20 ng p24/1.5 × 106 cells). After 48 h, cell lysates were analyzed for luciferase activity (in relative light units). Data represent means±s.d. of three independent experiments, with 100% corresponding to values obtained in Jurkat cells. (B–C) HIV Gag expression and release. Jurkat clones were infected with HIV(VSV), an env-deleted HIV, pseudotyped with VSV-G glycoproteins (0.75 ng p24/1.5 × 106 cells). After 72 h, Gag expression was measured by flow cytometry (B). One out of three independent experiments is shown. No Gag signal was detected with non-infected cells (not shown). (C) Gag p24 release was measured in cell supernatants by ELISA at 72 h p.i. Data represent means±s.d. of three independent experiments, with 100% corresponding to values obtained in P116 Zwt cells. (D) HIV proviral DNA synthesis. Jurkat clones were exposed to HIV-1 NL4-3 (0.2 ng p24/ml/106 cells) for 2 h and grown at 37°C for the indicated days. Quantification of late (pol DNA) viral products was performed by real-time PCR. Data are means±s.d. of triplicates and are representative of three independent experiments.
Figure 3
Figure 3
Impact of ZAP-70 on infectivity of cell-free virions and on cell-to-cell HIV transmission. (A) Infectivity of virions produced in ZAP-70-defective cells. Viruses produced in the indicated Jurkat clones was assayed in an infectivity assay. Supernatants were harvested at the pre-peak and peak of viral production (60–500 ng p24/ml). P4 reporter cells were exposed to HIV (NL4-3, 5 ng p24) and infection was assessed 24 h later, by measuring β-galactosidase activity in cell extracts. Data are means±s.d. of five independent experiments, with 100% corresponding to values obtained in Jurkat cells. (B, C) HIV cell-to-cell transfer does not require ZAP-70 in target cells. Productively HIV-1-infected Jurkat cells (20% Gag+ cells at the beginning of the assay) were co-cultivated with CFSE+ P116 or P116 Zwt target cells, at a 1/1 or a 1/5 donor/target ratio. The % of Gag+ cells among targets (CFSE+) is shown at the indicated times of coculture. (B) A representative experiment is shown. (C) A mean±s.d. of five independent experiments (24 h time point) is depicted, with 100% corresponding to values obtained in P116 Zwt cells.
Figure 4
Figure 4
ZAP-70 facilitates cell-to-cell HIV transfer to recipient cells. (A) Productively HIV-infected Jurkat and P116 cells (about 25% Gag+) were cocultivated with target CFSE+ Jurkat cells, at a 1/1 or a 1/5 ratio. The % of Gag+ cells among targets (CFSE+) is shown at the indicated times of coculture. (B) A mean±s.d. of six independent experiments (24 h time point) is depicted, with 100% corresponding to values obtained in Jurkat cells. (C) HIV productive transfer is sensitive to NVP. HIV-infected Jurkat and P116 cells (25% of Gag+ cells at the beginning of the assay) were cocultivated with target CFSE+ Jurkat cells, with or without NVP. The % of Gag+ cells among donors and targets, at 24 h post coculture, is indicated. Data are representative of three independent experiments.
Figure 5
Figure 5
Localization of HIV Gag and Env proteins in ZAP-70-defective cells. (A) Jurkat and P116-infected cells (about 50% Gag+) were fixed and stained with anti-Gag or anti-Env mAbs. Scale bar, 5 μm. A representative single medial optical section is shown in the fluorescence picture. Gag and Env stainings were negative in non-infected cells (not shown and Figure 7). Arrowheads point to discrete Gag spots. (B) Quantification of cells with discrete Gag spots. The indicated cells were infected with HIV and stained with anti-Gag antibodies. The % of infected cells with discrete bright Gag+ spots was measured by examining the cells with a fluorescence microscope. About 600 cells were analyzed for each condition, in four independent experiments. A mean±s.d. of four independent experiments is shown.
Figure 6
Figure 6
ZAP-70 facilitates formation of the VS. (A) Subcellular localization of Gag displayed by T cell conjugates. The indicated HIV-infected Jurkat derivatives (with about 50–60% of Gag+ cells) were incubated for 1 h with CFSE+ Jurkat cells, fixed and stained with anti-Gag mAbs. Scale bar, 5 μm. A representative single medial optical section is shown in the fluorescence picture. Arrowheads point to polarized Gag staining at the cell–cell junction. Right panels represent the density profiles of Gag fluorescence obtained from a XY projection of three medial optical sections. Color scale goes from blue (zero) to yellow (intermediate) to red (maximal). (B) Quantitative analysis of conjugates formation among Gag+ cells. Cells were treated as in (A) and the % of infected (Gag+) cells forming conjugates with target CFSE+ cells was quantified. A total number of about 600 cells were analyzed for each cell type condition, in four independent experiments. A mean±s.d. of four independent experiments is shown. (C) Quantitative analysis of Gag polarization at the cell–cell junction. Cells were treated as in (A) and the % of Gag+/CFSE+ cell conjugates harboring a polarized Gag staining at the cell interface was measured. A total number of about 200 conjugates were analyzed for each clone. A mean±s.d. of four independent experiments is shown.
Figure 7
Figure 7
MTOC localization in VSs. (A) Non-infected (NI) or HIV-infected Jurkat cells were incubated with Cell Trace-labelled target Jurkat cells (blue staining) for 1 h. Cells were then fixed and labelled with anti-Gag (red) and anti-centrin3 antibodies (green). Localization of MTOC in donor cells within conjugates was evaluated. Cells were scored positive for MTOC localization if the centrin labelling (pointed by a white arrowhead) was located in proximity to the cell–cell junction zone. (B) A mean±s.d. of three independent experiments is shown with the indicated cell clones. At least 400 conjugates were blindly scored for each cell type.
Figure 8
Figure 8
HIV replication in primary ZAP-70-deficient CD4+ T cells. (A) Kinetic analysis. HIV replication in primary CD4+ T cells from one control and one ZAP-70-negative donor. The X4 NL4-3 and R5 NLAD8 strains (2 and 20 ng p24/ml/106 cells) were used. Data are representative of four independent experiments. (B) Viral production at the peak. A mean±s.d. of four experiments, with cells from three controls and three ZAP-70-negative individuals, is depicted, with 100% corresponding to p24 values obtained in control cells at the peak. (C) Infectivity of virions. Viruses produced in the indicated primary cells were assayed in a P4 infectivity assay, as described in Figure 3. Data are means±s.d. of three independent experiments, with 100% corresponding to values obtained with ZAP-70+ cells. To produce high amounts of HIV in primary cells, a high MOI was used (100 ng p24/106 cells). (D–E) HIV Gag expression and release. Primary cells were infected with HIV(VSV), an env-deleted HIV, pseudotyped with VSV-G glycoproteins (100 ng p24/1.5 × 106 cells). After 72 h, Gag expression was measured by flow cytometry (D). One out of three independent experiments is shown. No Gag signal was detected with non-infected cells (not shown). (E) Gag p24 release was measured in cell supernatants by ELISA at 72 h p.i. Data represent means±s.d. of three independent experiments, with 100% corresponding to values obtained in P116 Zdk cells.

Similar articles

Cited by

References

    1. Abraham RT, Weiss A (2004) Jurkat T cells and development of the T-cell receptor signalling paradigm. Nat Rev Immunol 4: 301–308 - PubMed
    1. Arpaia E, Shahar M, Dadi H, Cohen A, Roifman CM (1994) Defective T cell receptor signaling and CD8+ thymic selection in humans lacking zap-70 kinase. Cell 76: 947–958 - PubMed
    1. Bacon KB, Szabo MC, Yssel H, Bolen JB, Schall TJ (1996) RANTES induces tyrosine kinase activity of stably complexed p125FAK and ZAP-70 in human T cells. J Exp Med 184: 873–882 - PMC - PubMed
    1. Barda-Saad M, Braiman A, Titerence R, Bunnell SC, Barr VA, Samelson LE (2005) Dynamic molecular interactions linking the T cell antigen receptor to the actin cytoskeleton. Nat Immunol 6: 80–89 - PubMed
    1. Barnard AL, Igakura T, Tanaka Y, Taylor GP, Bangham CR (2005) Engagement of specific T-cell surface molecules regulates cytoskeletal polarization in HTLV-1-infected lymphocytes. Blood 106: 988–995 - PubMed

Publication types

Substances