

Clustering of gene expression data: performance and similarity analysis
- PMID: 17217511
- PMCID: PMC1780119
- DOI: 10.1186/1471-2105-7-S4-S19
Clustering of gene expression data: performance and similarity analysis
Abstract
Background: DNA Microarray technology is an innovative methodology in experimental molecular biology, which has produced huge amounts of valuable data in the profile of gene expression. Many clustering algorithms have been proposed to analyze gene expression data, but little guidance is available to help choose among them. The evaluation of feasible and applicable clustering algorithms is becoming an important issue in today's bioinformatics research.
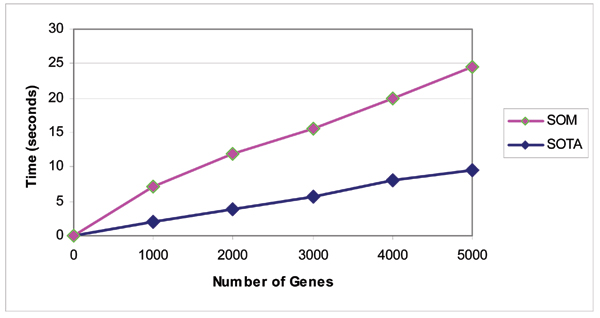
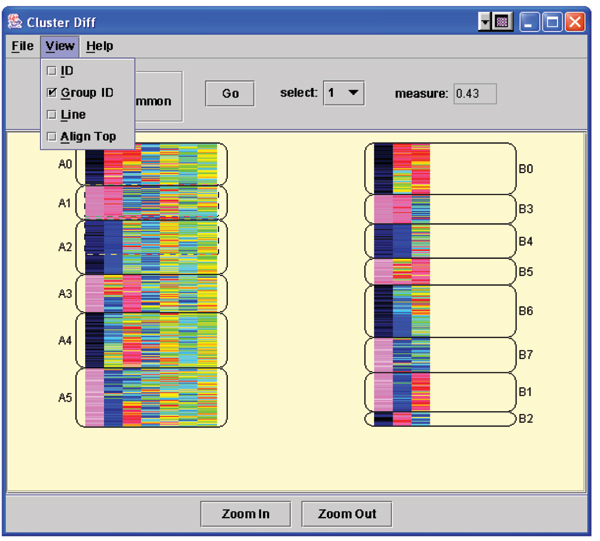
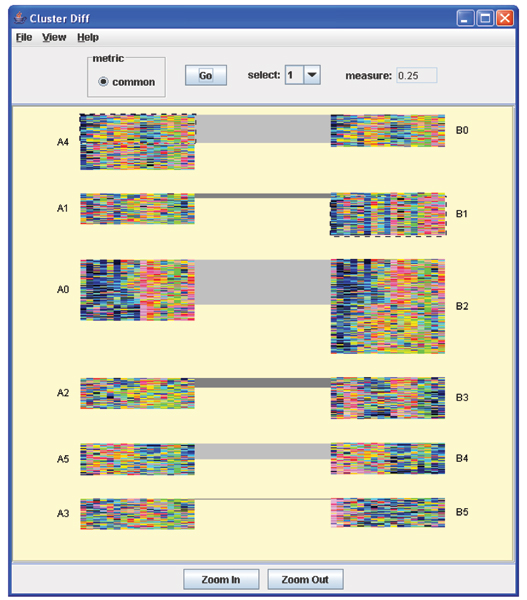
Results: In this paper we first experimentally study three major clustering algorithms: Hierarchical Clustering (HC), Self-Organizing Map (SOM), and Self Organizing Tree Algorithm (SOTA) using Yeast Saccharomyces cerevisiae gene expression data, and compare their performance. We then introduce Cluster Diff, a new data mining tool, to conduct the similarity analysis of clusters generated by different algorithms. The performance study shows that SOTA is more efficient than SOM while HC is the least efficient. The results of similarity analysis show that when given a target cluster, the Cluster Diff can efficiently determine the closest match from a set of clusters. Therefore, it is an effective approach for evaluating different clustering algorithms.
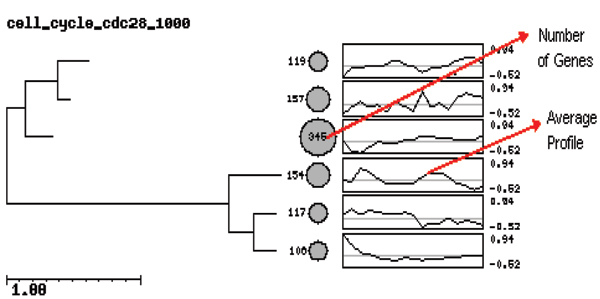
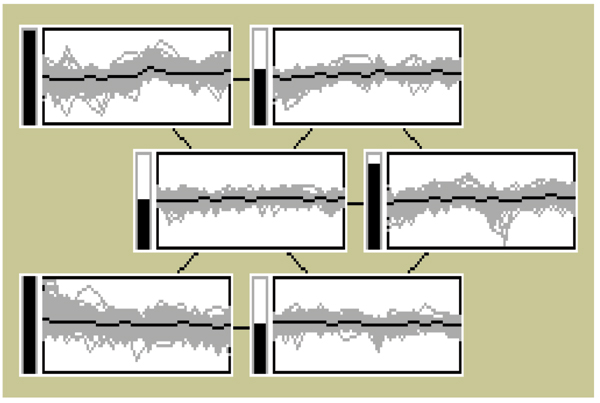
Conclusion: HC methods allow a visual, convenient representation of genes. However, they are neither robust nor efficient. The SOM is more robust against noise. A disadvantage of SOM is that the number of clusters has to be fixed beforehand. The SOTA combines the advantages of both hierarchical and SOM clustering. It allows a visual representation of the clusters and their structure and is not sensitive to noises. The SOTA is also more flexible than the other two clustering methods. By using our data mining tool, Cluster Diff, it is possible to analyze the similarity of clusters generated by different algorithms and thereby enable comparisons of different clustering methods.
Figures


Similar articles
-
An improved algorithm for clustering gene expression data.Bioinformatics. 2007 Nov 1;23(21):2859-65. doi: 10.1093/bioinformatics/btm418. Epub 2007 Aug 25. Bioinformatics. 2007. PMID: 17720981
-
Evaluation of clustering algorithms for gene expression data.BMC Bioinformatics. 2006 Dec 12;7 Suppl 4(Suppl 4):S17. doi: 10.1186/1471-2105-7-S4-S17. BMC Bioinformatics. 2006. PMID: 17217509 Free PMC article.
-
Detecting clusters of different geometrical shapes in microarray gene expression data.Bioinformatics. 2005 May 1;21(9):1927-34. doi: 10.1093/bioinformatics/bti251. Epub 2005 Jan 12. Bioinformatics. 2005. PMID: 15647300
-
Comparing algorithms for clustering of expression data: how to assess gene clusters.Methods Mol Biol. 2009;541:479-509. doi: 10.1007/978-1-59745-243-4_21. Methods Mol Biol. 2009. PMID: 19381534 Review.
-
How does gene expression clustering work?Nat Biotechnol. 2005 Dec;23(12):1499-501. doi: 10.1038/nbt1205-1499. Nat Biotechnol. 2005. PMID: 16333293 Review.
Cited by
-
Tumor Necrosis Factor Alpha and Insulin-Like Growth Factor 1 Induced Modifications of the Gene Expression Kinetics of Differentiating Skeletal Muscle Cells.PLoS One. 2015 Oct 8;10(10):e0139520. doi: 10.1371/journal.pone.0139520. eCollection 2015. PLoS One. 2015. PMID: 26447881 Free PMC article.
-
Integrative Analysis of MicroRNA and mRNA Data Reveals an Orchestrated Function of MicroRNAs in Skeletal Myocyte Differentiation in Response to TNF-α or IGF1.PLoS One. 2015 Aug 13;10(8):e0135284. doi: 10.1371/journal.pone.0135284. eCollection 2015. PLoS One. 2015. PMID: 26270642 Free PMC article.
-
Reconstruct modular phenotype-specific gene networks by knowledge-driven matrix factorization.Bioinformatics. 2009 Sep 1;25(17):2236-43. doi: 10.1093/bioinformatics/btp376. Epub 2009 Jun 19. Bioinformatics. 2009. PMID: 19542155 Free PMC article.
-
Development of computations in bioscience and bioinformatics and its application: review of the Symposium of Computations in Bioinformatics and Bioscience (SCBB06).BMC Bioinformatics. 2006 Dec 12;7 Suppl 4(Suppl 4):S1. doi: 10.1186/1471-2105-7-S4-S1. BMC Bioinformatics. 2006. PMID: 17217501 Free PMC article.
-
Serum microRNA as a potential biomarker for the activity of thyroid eye disease.Sci Rep. 2023 Jan 5;13(1):234. doi: 10.1038/s41598-023-27483-w. Sci Rep. 2023. PMID: 36604580 Free PMC article.
References
-
- Botstein D, Brown P. Exploring the new world of the genome with DNA microarrays. Nature Genetics. 1999;21:33–37. - PubMed
-
- Sneath , Sokal Hierarchical Clustering. 1973.
-
- Kohonen T. Self-Organizing Maps. Springer, Berlin; 1995.
Publication types
MeSH terms
LinkOut - more resources
Full Text Sources
Molecular Biology Databases
