

The impact of sample imbalance on identifying differentially expressed genes
- PMID: 17217526
- PMCID: PMC1780111
- DOI: 10.1186/1471-2105-7-S4-S8
The impact of sample imbalance on identifying differentially expressed genes
Abstract
Background: Recently several statistical methods have been proposed to identify genes with differential expression between two conditions. However, very few studies consider the problem of sample imbalance and there is no study to investigate the impact of sample imbalance on identifying differential expression genes. In addition, it is not clear which method is more suitable for the unbalanced data.
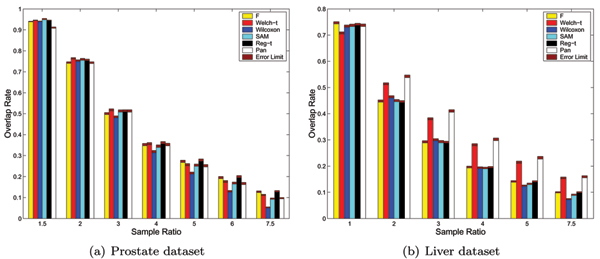
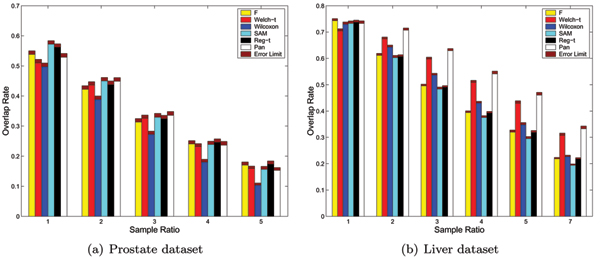
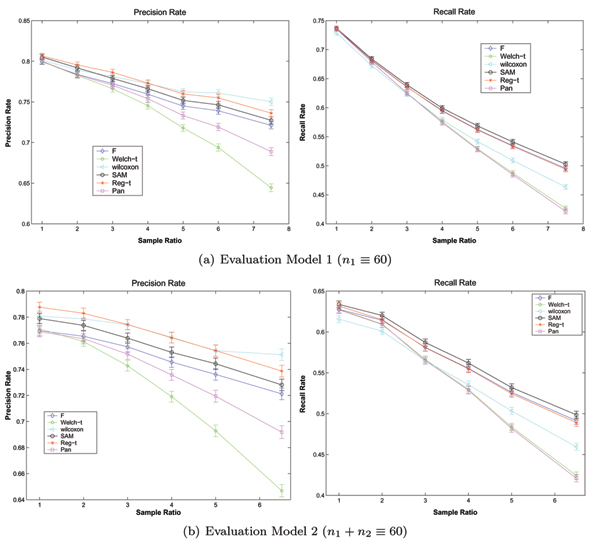
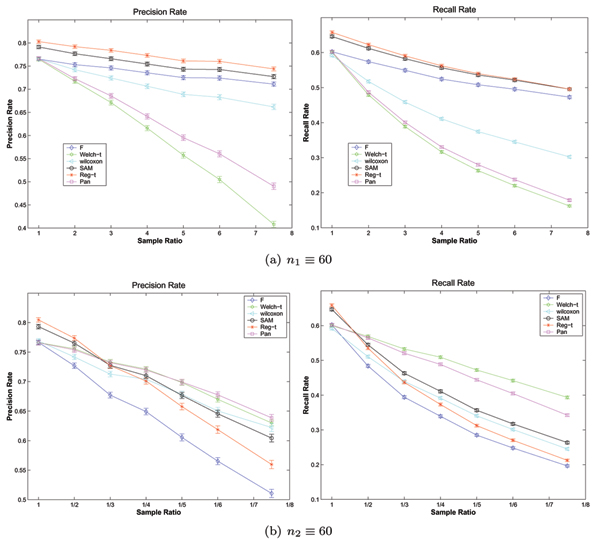
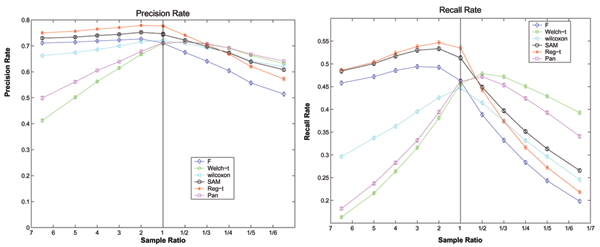
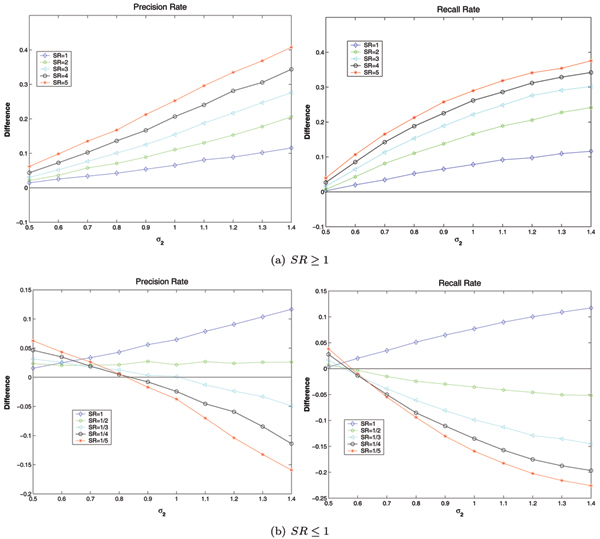
Results: Based on random sampling, two evaluation models are proposed to investigate the impact of sample imbalance on identifying differential expression genes. Using the proposed evaluation models, the performances of six famous methods are compared on the unbalanced data. The experimental results indicate that the sample imbalance has a great influence on selecting differential expression genes. Furthermore, different methods have very different performances on the unbalanced data. Among the six methods, the welch t-test appears to perform best when the size of samples in the large variance group is larger than that in the small one, while the Regularized t-test and SAM outperform others on the unbalanced data in other cases.
Conclusion: Two proposed evaluation models are effective and sample imbalance should be taken into account in microarray experiment design and gene expression data analysis. The results and two proposed evaluation models can provide some help in selecting suitable method to process the unbalanced data.
Figures
Similar articles
-
Comparison of seven methods for producing Affymetrix expression scores based on False Discovery Rates in disease profiling data.BMC Bioinformatics. 2005 Feb 10;6:26. doi: 10.1186/1471-2105-6-26. BMC Bioinformatics. 2005. PMID: 15705192 Free PMC article.
-
Sample size for FDR-control in microarray data analysis.Bioinformatics. 2005 Jul 15;21(14):3097-104. doi: 10.1093/bioinformatics/bti456. Epub 2005 Apr 21. Bioinformatics. 2005. PMID: 15845654
-
Construction of null statistics in permutation-based multiple testing for multi-factorial microarray experiments.Bioinformatics. 2006 Jun 15;22(12):1486-94. doi: 10.1093/bioinformatics/btl109. Epub 2006 Mar 30. Bioinformatics. 2006. PMID: 16574697
-
Significance analysis of microarray transcript levels in time series experiments.BMC Bioinformatics. 2007 Mar 8;8 Suppl 1(Suppl 1):S10. doi: 10.1186/1471-2105-8-S1-S10. BMC Bioinformatics. 2007. PMID: 17430554 Free PMC article.
-
Microarray data analysis: a hierarchical T-test to handle heteroscedasticity.Appl Bioinformatics. 2004;3(4):229-35. Appl Bioinformatics. 2004. PMID: 15702953
Cited by
-
Considerations for reproducible omics in aging research.Nat Aging. 2023 Aug;3(8):921-930. doi: 10.1038/s43587-023-00448-4. Epub 2023 Jun 29. Nat Aging. 2023. PMID: 37386258 Free PMC article. Review.
-
A robustness study of parametric and non-parametric tests in model-based multifactor dimensionality reduction for epistasis detection.BioData Min. 2013 Apr 25;6(1):9. doi: 10.1186/1756-0381-6-9. BioData Min. 2013. PMID: 23618370 Free PMC article.
-
Modeling group heteroscedasticity in single-cell RNA-seq pseudo-bulk data.Genome Biol. 2023 May 5;24(1):107. doi: 10.1186/s13059-023-02949-2. Genome Biol. 2023. PMID: 37147723 Free PMC article.
-
Diagnosing rare diseases after the exome.Cold Spring Harb Mol Case Stud. 2018 Dec 17;4(6):a003392. doi: 10.1101/mcs.a003392. Print 2018 Dec. Cold Spring Harb Mol Case Stud. 2018. PMID: 30559314 Free PMC article. Review.
-
Coevolution of prostate cancer and bone stroma in three-dimensional coculture: implications for cancer growth and metastasis.Cancer Res. 2008 Dec 1;68(23):9996-10003. doi: 10.1158/0008-5472.CAN-08-2492. Cancer Res. 2008. PMID: 19047182 Free PMC article.
References
-
- Golub TR, Slonim DK, Tamayo P, Huard C, Gaasenbeek M, Mesirov JP, Coller H, Loh M, Downing J, Caligiuri MA, Bloomfield CD, Lander ES. Molecular Classification of Cancer: Class Discovery and Class Prediction by Gene Expression Monitoring. Science. 1999;286:531–537. doi: 10.1126/science.286.5439.531. - DOI - PubMed
Publication types
MeSH terms
LinkOut - more resources
Full Text Sources
