. 2007 Feb;47(4):569-79.
doi: 10.1016/j.visres.2006.09.016. Epub 2007 Jan 10.

Second-order motion without awareness: passive adaptation to second-order motion produces a motion aftereffect

Affiliations

Second-order motion without awareness: passive adaptation to second-order motion produces a motion aftereffect

David Whitney et al. Vision Res. 2007 Feb.

Abstract

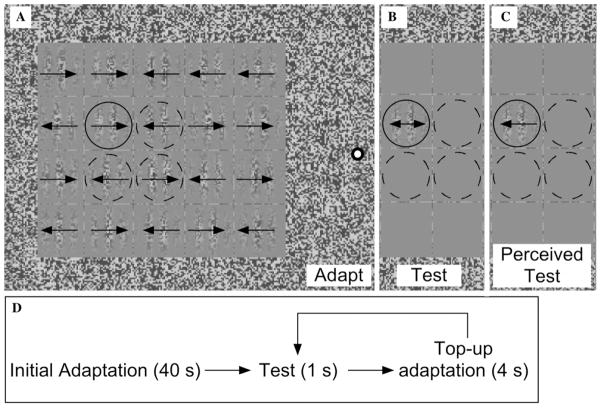
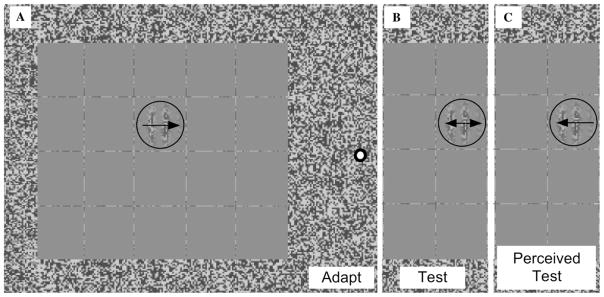
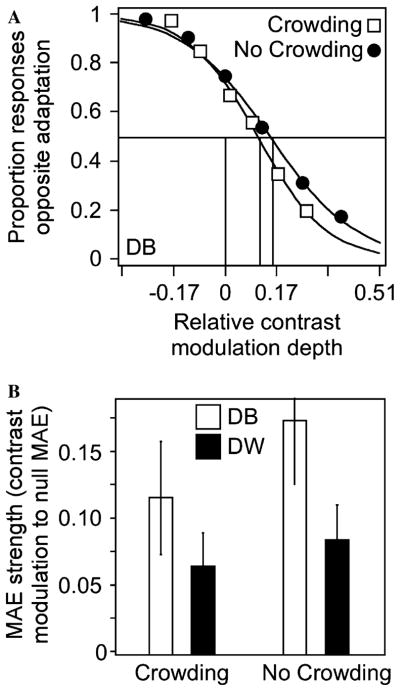
Although second-order motion may be detected by early and automatic mechanisms, some models suggest that perceiving second-order motion requires higher-order processes, such as feature or attentive tracking. These types of attentionally mediated mechanisms could explain the motion aftereffect (MAE) perceived in dynamic displays after adapting to second-order motion. Here we tested whether there is a second-order MAE in the absence of attention or awareness. If awareness of motion, mediated by high-level or top-down mechanisms, is necessary for the second-order MAE, then there should be no measurable MAE if the ability to detect directionality is impaired during adaptation. To eliminate the subject's ability to detect directionality of the adapting stimulus, a second-order drifting Gabor was embedded in a dense array of additional crowding Gabors. We found that a significant MAE was perceived even after adaptation to second-order motion in crowded displays that prevented awareness. The results demonstrate that second-order motion can be passively coded in the absence of awareness and without top-down attentional control.


Figures

Fig. 1
Fig. 1
Stimulus from the first experiment. (A) An array of second-order, contrast-defined Gabors was presented so closely spaced that the direction of motion in the central Gabors could not be identified (due to crowding). The direction of motion in each of the Gabors was randomized across trials, except the four central Gabors (circled), whose motion was fixed (to build adaptation). (B) During the test period a dynamic Gabor (drift-balanced contrast-modulated sinusoids moving in opposite directions) was presented in one of the four adapted regions (circled). In this example, the test Gabor contains perfectly drift-balanced motion (no net physical motion) (C) Because of the prior motion adaptation, the dynamic test Gabor in (B) displayed an illusory motion aftereffect (MAE) opposite the direction of prior adaptation. (D) Trial sequence. Subjects initially adapted for 40 s to the array in (A), followed by interleaved test and top-up adaptation periods.
Fig. 2
Fig. 2
Example second-order Gabor used in the first experiment. (A). The Gabor consisted of a dynamic random dot pattern, modulated by a contrast-defined sinusoid (dashed line in B) that drifted either leftward or rightward, and a Gaussian contrast-modulated envelope (to blur the edges; solid line in B). The sinusoidal contrast modulation (visible here as random dots alternating with gray bars) was the only moving component. The Gaussian contrast-modulated envelope was always static. The dynamic random dot background was updated every frame and produced a broadband noise (e.g., T.V. snow). The pictured pattern has a sinusoidal modulation with exaggerated contrast depth to reproduce in print; the actual Gabor had much lower contrast. Formally, the Gabor is described as: L(x,y,t)=E+{V-E+[E-V+(R(x,y,t)D)2(1+sin{[(SFx)+(TFt)]2π})]}exp(-r2(σM)2), where L(x,y,t) is the luminance at any point at time t; E is physical equiluminance (mean luminance); V is subject’s equiluminance value (see Methods); R(x,y,t) is a random-dot array in time; D is the depth of the contrast modulation (the incremental contrast above and below E); SF is the spatial frequency of the sine wave contrast modulation (pixels/cycle); TF is the temporal frequency of the sine wave (cyc/frame); r is distance of (x,y) from the center of the Gabor; σ is the standard deviation of the static Gaussian contrast envelope; and M is the maximum radius of the Gaussian envelope. Because the monitor’s refresh was 100 Hz, t is defined in 10 ms increments. (B) The luminance contrast profile of the second-order Gabor. The sinusoidal contrast modulation (dashed line) varies from low to high contrast, and is the only drifting component. The static Gaussian contrast-modulated envelope is indicated by the solid line.
Fig. 3
Fig. 3
Nulling method used in the first experiment. (A) To measure the MAE, two contrast-modulated sine waves were drifted in opposite directions. The perceived motion in the pattern is dictated by the relative contrast of the two sine waves. If the contrast of the rightward sinusoid is higher, the perceived motion in the pattern follows a rightward direction. (B) If the contrast of the two sine waves is equal, then they are perfectly drift balanced and there is no perceived motion (i.e., they just flicker).
Fig. 4
Fig. 4
Results of the first experiment.(A) A psychometric function for one subject in one condition following adaptation to second-order motion in the crowded array from Fig. 1. The abscissa shows the relative contrast modulation depth of the two sine wave contrast modulations (i.e., as in Fig. 3). Negative values indicate that the test Gabor contained net motion opposite the direction of prior adaptation (in the direction of an MAE); positive values indicate that the net motion in the test Gabor was in the same direction as adaptation. The ordinate shows the proportion of subject responses that were opposite the direction of adaptation (in the direction of the MAE). The PSE (the 50% point on the curve) was ~0.10 (the weakest effect of any measured), indicating that the test Gabor needed to contain net motion (higher contrast) in the direction of adaptation to null the perceived MAE (a significant MAE; χ2 = 7.8, P < 0.01). (B) Results for two subjects, showing a significant MAE perceived on each of the tested Gabor contrasts. The open symbols show the perceived second-order MAE in experimental sessions in which the subjects were required to judge the direction of motion in the adaptation Gabor as well as the test pattern. When guessing the direction of motion in the adaptation Gabor, subjects DB and DW were at 50.8% and 53% accuracy, respectively, which reveals that crowding was effective at preventing awareness of motion direction. Error bars, ±SEM.
Fig. 5
Fig. 5
Stimulus used in the first stage of Experiment 2. (A) Subjects adapted to an array of low contrast first-order Gabors (the contrast is greatly exaggerated here for visibility). During the test period, second-order (B) or first-order Gabors (C) could be presented.
Fig. 6
Fig. 6
Results of the second experiment. The MAE is plotted for first-and second-order Gabors as a function of first-or second-order adaptation. Each graph’s ordinate has two scales: on the right is the raw MAE magnitude (as in Fig. 4). This scale refers to the circular data points connected with dashed lines. On the left is the MAE expressed as a multiple of threshold discrimination (referring to the bars in the graph); to more directly compare first and second-order MAEs, we divided the PSE (contrast required to null the MAE) by the threshold contrast discrimination (estimated as half the distance between the 25% and 75% response proportions on the psychometric function, as in Fig. 4). This accounted for the fact that discriminating first-order test patterns is much easier than second-order test patterns. The PSEs (average of two subjects, as in Fig. 4) are shown by the circles connected with a dashed line. Both estimates of the MAE yield identical results. (A) Following first-order adaptation (Fig. 5), the MAE was significant for luminance-defined test Gabors, but was insignificant for contrast-defined test Gabors (asterisks indicate significance at the 0.01 level; χ2 test). A dynamic first-order test pattern was therefore a more sensitive measure of luminance-defined motion adaptation. (B) Following second-order adaptation (e.g., Fig. 1), there was a significant MAE only for the contrast-defined test Gabors (P < 0.01). If the second-order adaptation Gabors had contained a luminance artifact, the first-order test Gabors should have displayed a stronger MAE. The fact that there was very little, if any, crossover adaptation (from second-order motion adaptation to first-order test patterns) shows that luminance artifacts are not responsible for the results in the first experiment.
Fig. 7
Fig. 7
Stimulus used in Experiment 3. (A) Rather than adapting to an array of second-order Gabors, subjects adapted to a single Gabor. (B and C) The same test Gabors were used from Experiment 1, which display an MAE following adaptation.
Fig. 8
Fig. 8
Results of Experiment 3. (A) Psychometric functions showing the MAE with and without crowding for subject DB. (B) There was a slight reduction in the MAE under crowding conditions for both subjects, but this difference was not significant (the most significant difference was for subject DB; χ2(1) = 1.80, P > 0.05). The fact that there is only a modest decrement in the MAE under crowding conditions suggests that adaptation was at a predominantly local spatial scale, and that global characteristics, pattern or ensemble statistics, and spatially distributed effects do not contribute (or contribute very little) to the passive second-order motion coding found in the first experiment. Error bars, ±SEM.

References

    1. Aghdaee SM. Adaptation to spiral motion in crowding condition. Perception. 2005;34(2):155–162. - PubMed
    1. Aghdaee SM, Zandvakili A. Adaptation to spiral motion: global but not local motion detectors are modulated by attention. Vision Research. 2005;45(9):1099–1105. - PubMed
    1. Allen HA, Ledgeway T. Attentional modulation of threshold sensitivity to first-order motion and second-order motion patterns. Vision Research. 2003;43(27):2927–2936. - PubMed
    1. Anstis SM, Cavanagh P. A minimum motion technique for judging equiluminance. In: Mollon J, Sharpe RT, editors. Color vision: Physiology and psychophysics. London: Academic Press; 1983. pp. 155–166.
    1. Anstis SM, Reinhardt-Rutland AH. Interactions between motion aftereffects and induced movement. Vision Research. 1976;16(12):1391–1394. - PubMed

Publication types