. 2007 Jun;158(3):293-306.
doi: 10.1016/j.jsb.2006.11.004. Epub 2006 Nov 21.

Analysis of the orientation of primary cilia in growth plate cartilage: a mathematical method based on multiphoton microscopical images

Affiliations

Analysis of the orientation of primary cilia in growth plate cartilage: a mathematical method based on multiphoton microscopical images

Maria-Grazia Ascenzi et al. J Struct Biol. 2007 Jun.

Abstract

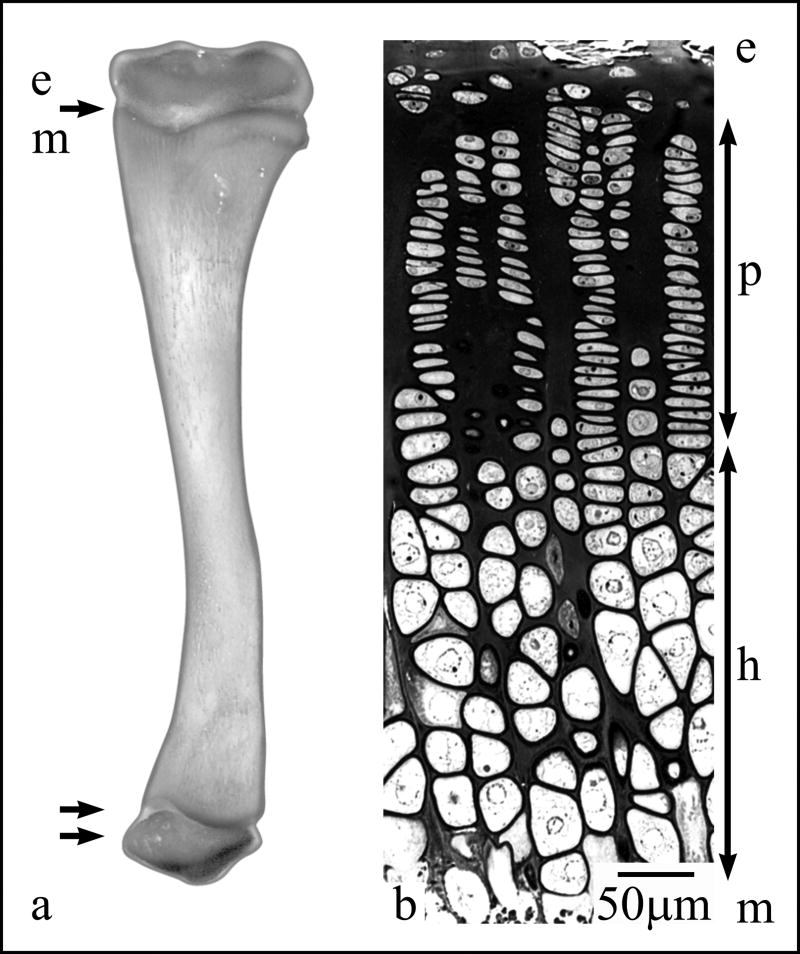
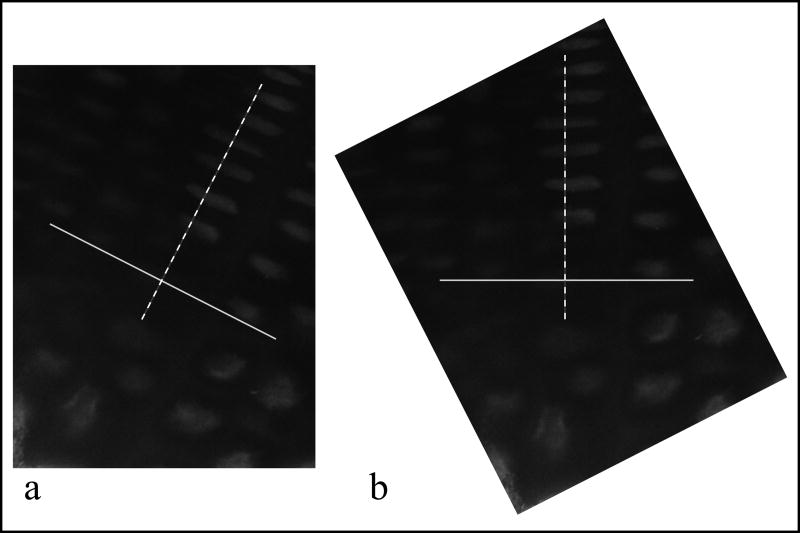
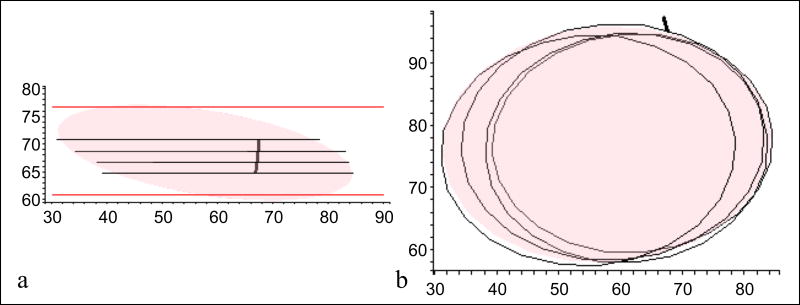
The chondrocytic primary cilium has been hypothesized to act as a mechano-sensor, analogously to primary cilium of cells in epithelial tissues. We hypothesize that mechanical inputs during growth, sensed through the primary cilium, result in directed secretion of the extracellular matrix, thereby establishing tissue anisotropy in growth plate cartilage. The cilium, through its orientation in three-dimensional space, is hypothesized to transmit to the chondrocyte the preferential direction for matrix secretion. This paper reports on the application of classical mathematical methods to develop an algorithm that addresses the particular challenges relative to the assessment of the orientation of the primary cilium in growth plate cartilage, based on image analysis of optical sections visualized by multiphoton microscopy. Specimens are prepared by rapid cold precipitation-based fixation to minimize possible artifactual post-mortem alterations of ciliary orientation. The ciliary axoneme is localized by immunocytochemistry with antibody acetylated-alpha-tubulin. The method is applicable to investigation of ciliary orientation in different zones of the growth plate, under either normal or altered biomechanical environments. The methodology is highly flexible and adaptable to other connective tissues where tissue anisotropy and directed secretion of extracellular matrix components are hypothesized to depend on the tissue's biomechanical environment during development and growth.


Figures

Figure 1
Figure 1
(a) The proximal (single arrow) and distal (double arrow) growth plates of the tibia of a four-week-old rat are cartilaginous discs, each located between the epiphyseal bone (“e”), and the metaphyseal bone (“m”), at each end of the tibia. (b) This microradiograph shows bone elongation which occurs during the differentiation cascade of chondrocytes in the proximal tibial growth plate of a four-week-old rat. This 1μm-thick section was stained with methylene blue/azure II to demonstrate the morphology of cells and matrix. The anisotropic arrangement of chondrocytes is demonstrated by the columns of cells, which are a spatial representation of the temporal differentiation of individual chondrocytes. Cellular division is restricted to the proliferative zone (“p”); terminal differentiation is characterized by a significant increase in cellular volume, together with a shape change in the hypertrophic zone (“h”). The death of the terminal chondrocyte occurs just above the metaphyseal bone (“m”).
Figure 2
Figure 2
The images depict ciliary orientations that are consistent with the way they were found in the growth plate and the way that images of growth plates are oriented by the regular convention, that is, with the epiphyseal bone at the top and the metaphyseal bone at the bottom. (a) This TEM micrograph of the primary cilium shows a hypertrophic cell in the distal radial growth plate of a four-week-old minipig. The axonemal profile (short arrowheads) projects into the extracellular matrix, and appears as an extension of the more electron dense basal body, which lies within the cellular cytoplasm (long arrows). The centriole appears in transverse section. The Golgi stacks (short arrows) are numerous in the region of the centriole. (b) The profiles of two early hypertrophic cells by MPM, whose ciliary axoneme of each cell fluoresces green, demonstrating reaction with the acetylated-α-tubulin antibody. (c) A field of cells and their associated primary cilia are shown at slightly lower magnification. The Golgi stacks (double arrows) are reactive as well with the acetylated-α-tubulin antibody. Because the Golgi stack is positioned entirely in the cells, the Golgi stack is clearly differentiated from the ciliary axoneme of the same cell. The cilium profile at the bottom right of the image appears almost punctate, indicating that the axoneme is essentially projecting in the z-direction of the z-stack.
Figure 3
Figure 3
This series of seven consecutive images belongs to a z-series taken at 2μm intervals by MPM. Note that the ciliary axoneme is clearly viewed in two chondrocytes through three sections. This type of images was the input for the morphometry and the subsequent mathematical algorithm.
Figure 4
Figure 4
The flow chart lists the steps applied to the z-stack for morphometry and subsequent mathematical algorithm.
Figure 5
Figure 5
(a) An xy-reference system is chosen for each image, 309x : the origin of the axes is placed at the lower left corner of the image; the x-axis parallels the horizontal side of the image and the y-axis parallels the vertical side of the image. (b) This is an enlargement of ellipse and segment for cell #1 in (a) relative to the first scan on which the cellular optical section was visible. (c) Ellipses and segments relative to the four images on which cell #1 appeared.
Figure 6
Figure 6
(a) The axis perpendicular to the cell general orientation (segmented) on the xy-plane was determined. (b) All images were rotated to restore the orientation of the image to the orientation of the specimen prior to isolation from tibia. Here the y-axis represents the direction of growth. The y-value measures the position of the cell within the specimen and was called “position” parameter.
Figure 7
Figure 7
(a) The ellipses relative to cell #1 were obtained by plotting the equations obtained from the morphometric data. For example, the red ellipses is the plot of x=−23.80cos(th)+1.23sin(th)+54.67,y=−1.57cos(th)−18.56sin(th)+76.03,z=70.75, for 0≤th≤2π. The graphs matched well the elliptical cellular profiles which were originally drawn on the microscopical images (b).
Figure 8
Figure 8
For a segment (colored in grey), the Euleurian angles θ and ϕ are marked with respect to the xyz-reference system. Usually, 0≤θ≤2π and 0≤ϕ≤π. Here 0≤ϕ≤2π was chosen to assess orientation along which the cilium is pointing away from the cell within the four quadrants.
Figure 9
Figure 9
(a)-(d) show from four different view points the sets of ellipses that describe the cellular profiles obtained from the experimental images of the specimen, represented by the green box. In (d) the ellipses are distanced from each other for detailed visualization.
Figure 10
Figure 10
The three-dimensional model of cell #1 with its cilium (in black) is viewed from two different angles (a and b). The pink ellipsoid is the plot of the equations x=26.61cos(th)sin(ph)+1.26sin(th)sin(ph)−1.19cos(ph)+57.67, y=1.76cos(th)sin(ph)−19.06sin(th)sin(ph)−0.08cos(ph)+77.03, z=−4.22cos(th)sin(ph)+7.55cos(ph)+68.55, for 0≤th≤2π, 0≤ph≤π. The red lines are indicative of the middle plane of the first and the last scans on which the cell appeared without cilium. The projection of the pink ellipsoid on the xy-plane in (b) matches the two-dimensional ellipses in Figure 7.

References

    1. Angenent S, Pichon E, Tannenbaum A. Mathematical methods in medical image processing. Bull Amer Math Soc. 2006;43:365–396. - PMC - PubMed
    1. Badano JL, Teslovich TM, Katsanis N. The centrosome in human genetic disease. Nat Rev Gen. 2005;6:194–205. - PubMed
    1. Beertsen W, Everts V, Houtkooper JM. Frequency of occurrence and position of cilia in fibroblasts of the periodontal ligament of the mouse incisor. Cell Tissue Res. 1975;163:415–431. - PubMed
    1. Bisgrove BW, Yost HJ. The roles of cilia in developmental disorders and disease. Development. 2006;133:4131–4143. - PubMed
    1. Bray RC, Salo PT, Lo IK, Ackermann P, Rattner JB, Hart DA. Normal ligament structure, physiology and function. Sports Med Arthr Rev. 2005;13:127–135.

Publication types

LinkOut - more resources