. 2007 Jan 12;128(1):45-57.
doi: 10.1016/j.cell.2006.12.017.

Mutations in alpha-tubulin cause abnormal neuronal migration in mice and lissencephaly in humans

Affiliations

Mutations in alpha-tubulin cause abnormal neuronal migration in mice and lissencephaly in humans

David A Keays et al. Cell. .

Abstract

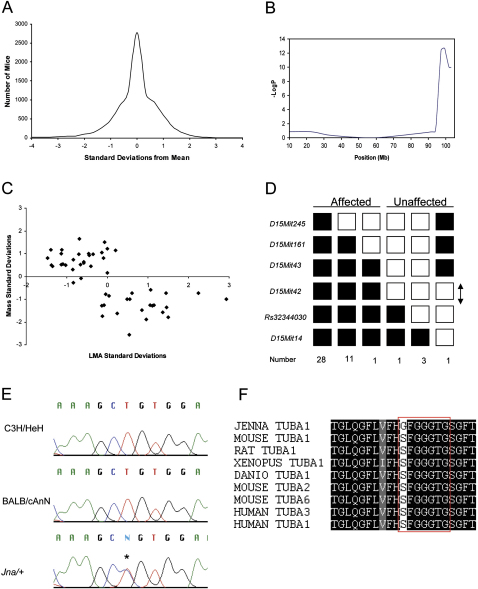
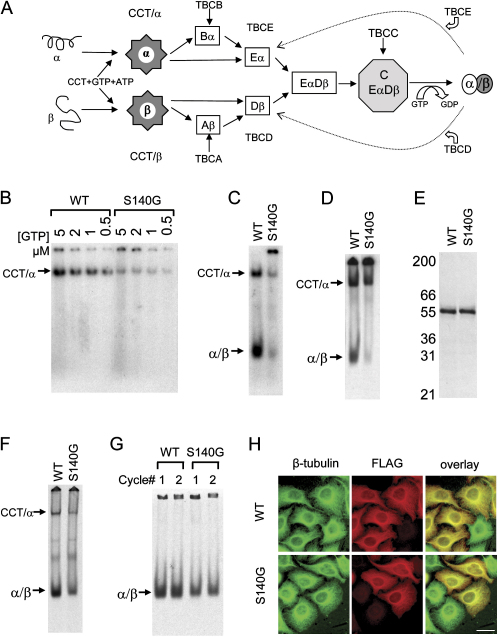
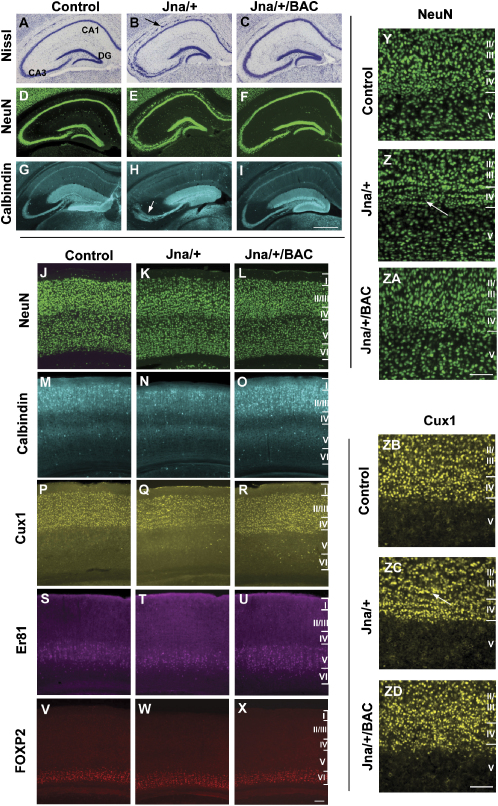
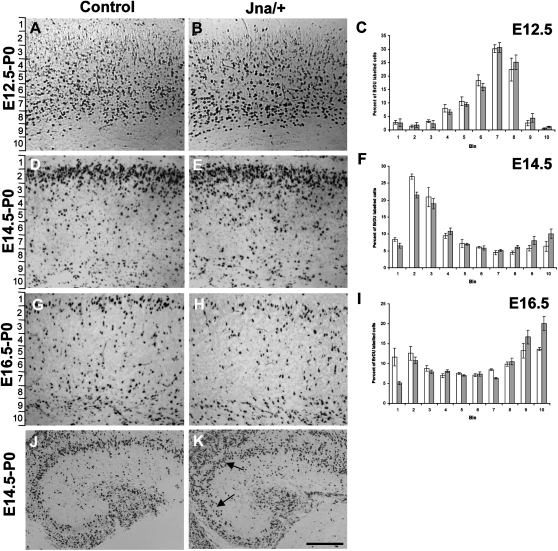
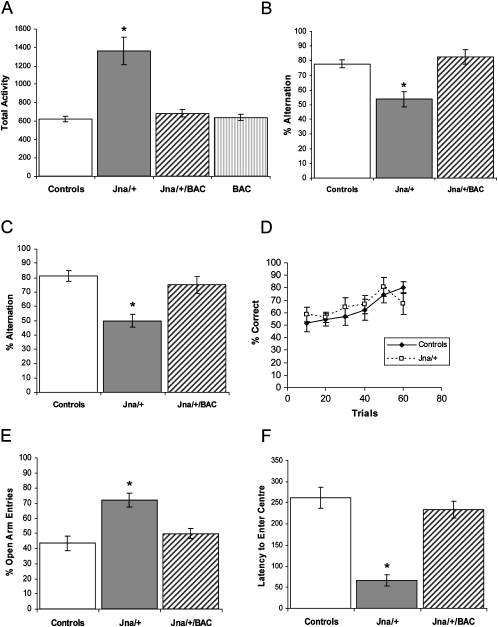
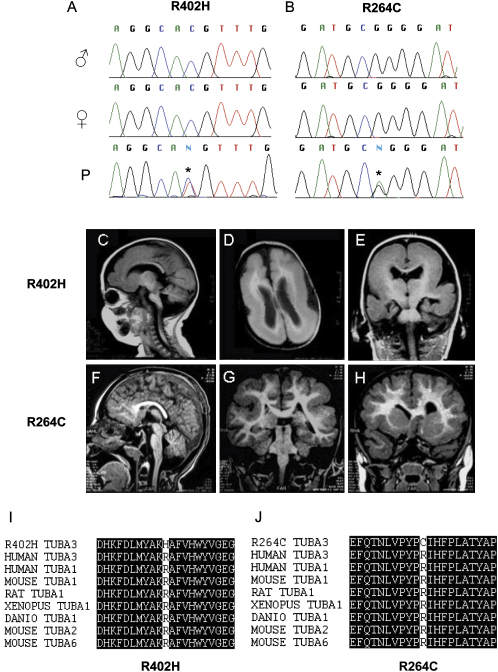
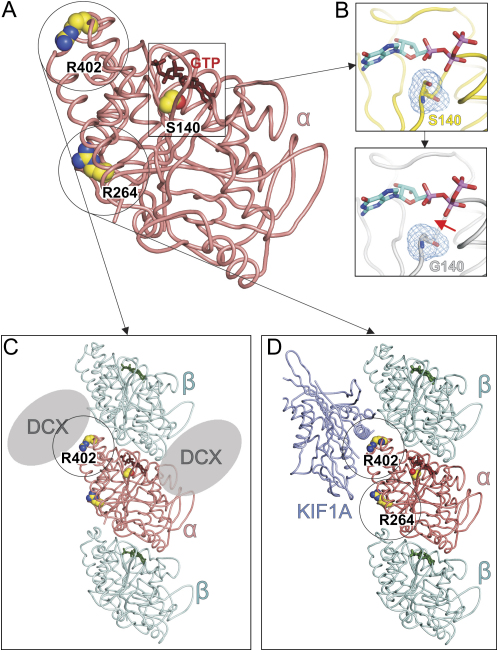
The development of the mammalian brain is dependent on extensive neuronal migration. Mutations in mice and humans that affect neuronal migration result in abnormal lamination of brain structures with associated behavioral deficits. Here, we report the identification of a hyperactive N-ethyl-N-nitrosourea (ENU)-induced mouse mutant with abnormalities in the laminar architecture of the hippocampus and cortex, accompanied by impaired neuronal migration. We show that the causative mutation lies in the guanosine triphosphate (GTP) binding pocket of alpha-1 tubulin (Tuba1) and affects tubulin heterodimer formation. Phenotypic similarity with existing mouse models of lissencephaly led us to screen a cohort of patients with developmental brain anomalies. We identified two patients with de novo mutations in TUBA3, the human homolog of Tuba1. This study demonstrates the utility of ENU mutagenesis in the mouse as a means to discover the basis of human neurodevelopmental disorders.


Figures

Figure 1
Figure 1
Behavioral Screen and Genetic Mapping (A) Results of the locomotor activity screen showing the distribution of mice as a function of the number of standard deviations from the mean. (B) Genetic mapping results for total beam breaks on chromosome 15 when analyzed with QTL cartographer employing a linear regression. Significant linkage was obtained to distal chromosome 15 (LogP = 12.6). (C) Correlation between weight and locomotor behavior. Mice fall into two groups: (1) low activity mice with a larger mass and (2) hyperactive mice with a smaller mass. (D) Fine mapping for the Jna pedigree. Black boxes represent heterozygosity for the BALB/cAnN allele and the white boxes homozygotes C3H/HeH. The number of progeny inheriting each haplotype is listed on the bottom line. Haplotype analysis indicated that the mutation falls within a 1.3 Mb region between D15Mit43 and rs32344030, shown with an arrow. (E) Sequencing traces from exon 4 in Tuba1 from C3H/HeH, BALB/cAnN, and an affected Jna/+ mouse. The mutation, highlighted with a star, is a T to C transition. (F) Alignment of α-tubulin isotypes from various species. The mutation in the Jna/+ mouse substitutes a serine with a glycine residue that is conserved in all α-tubulins. The boxed residues are known to interact directly with GTP.
Figure 2
Figure 2
Tuba1 S140G Has a Reduced Ability to Incorporate GTP, Resulting in a Marked Decline in the Efficiency of Tubulin Heterodimer Formation (A) The tubulin heterodimer assembly pathway. Newly synthesized α/β-tubulin polypeptides undergo one or more rounds of ATP-dependent interaction with cytosolic chaperonin (CCT). Quasi-native intermediates formed as a result of this interaction are then captured and stabilized by a series of tubulin-specific chaperones termed TBCA–TBCE. α-tubulin intermediates interact with TBCB and TBCE, while β-tubulin intermediates interact with TBCA and TBCD. TBCEα (Eα) and TBCDβ (Dβ) together form a supercomplex. Entry of TBCC into this supercomplex triggers GTP hydrolysis by β-tubulin; this acts as a switch for the discharge of the newly assembled α/β heterodimer. This is based on Tian et al. (2006). (B) Incorporation of labeled GTP into CCT bound folding intermediates. Reaction products, analyzed by nondenaturing gel electrophoresis, show an approximately 5-fold reduction in GTP bound intermediates (CCT/α) in the case of the S140G mutant. (C) Incorporation of labeled GTP in fully reconstituted in vitro tubulin-folding reactions containing CCT, ATP, GTP, TBCB, TBCC, TBCD, and TBCE; native brain tubulin; and equal amounts of wild-type or S140G mutant α-tubulin. Products analyzed by nondenaturing gel electrophoresis show a reduction in the level of native α/β-tubulin heterodimers. (D) Incorporation of 35S-labeled wild-type or mutant (S140G) Tuba1 in fully reconstituted in vitro reactions confirm a reduction in the production of native α/β-tubulin heterodimers in the case of the S140G mutant. (E and F) In vitro transcription and translation in rabbit reticulocyte lysate in the presence of 35S-methionine. Products analyzed by SDS (E) or nondenaturing gel electrophoresis (F) demonstrate that the mutation does not affect translation of the protein (E) in contrast to the diminished yield of heterodimers in (F). In (E) molecular mass markers (in kDa) are shown on the left. (G) Microtubule polymerization/depolymerization. Cycling of 35S-labeled, in vitro translated wild-type and mutant (S140G) tubulin with native bovine brain microtubules demonstrates that wild-type and mutant heterodimers are equally capable of incorporation into microtubules. (H) The S140G mutant α-1 tubulin incorporates into microtubules in vivo. C-terminally FLAG-tagged wild-type or mutant Tuba1 were transfected into HeLa cells and the microtubule network visualized by staining with a polyclonal anti-β-tubulin antibody (shown in green) and a monoclonal anti-FLAG antibody (shown in red). Calibration bar shows 10 μm. Arrows in panels (D), (E), (F), and G denote the location of the α-tubulin/CCT binary complex (CCT/α) or the native tubulin heterodimer (α/β).
Figure 3
Figure 3
Abnormal Hippocampal and Cortical Morphology in Jna/+ Mice (A–I) Coronal sections of the hippocampus from littermate controls, heterozygote (Jna/+) and rescued (Jna/+/BAC) animals aged 8 weeks when stained with cresyl violet (A–C), NeuN (D–F), and calbindin (G–I). These stains reveal a fractured pyramidal cell layer (shown with an arrow) that is most severe in the CA3, fewer calbindin-positive pyramidal neurons in the CA1 region, and a disorganized mossy fiber tract (arrowed). (J–ZD) Coronal sections of the visual cortex when stained with anti-sera for NeuN (J–L, Y–ZA), calbindin (M–O), Cux-1 (P–R, ZB–ZD), Er81 (S–U), and FOXP2 (V–X) from mice aged 8 weeks. These stains showed that the laminar structure of the cortex is preserved; however, on closer examination of NeuN (Y–ZA) and Cux-1 (ZB–ZD) staining, wave-like perturbations in layers II/III and IV (arrowed) can be seen. The calibration bar for the hippocampus shows 500 μm. The calibration bars for the cortex show 200 μm.
Figure 4
Figure 4
Abnormal Neuronal Migration in Jna/+ Mice (A–I) Staining for BrdU in the cortex and hippocampus of littermate controls and mutant pups harvested at P0, after injection of BrdU at E12.5 (A and B), E14.5 (D and E) and E16.5 (G and H). The cortex was divided into ten equal bins (shown on the left), extending from the intermediate zone to the molecular layer and BrdU-positive cells counted blind to the genotype. Panels (C), (F), and (I) show the mean percentage of BrdU-labeled cells in bins 1 to 10 for wild-type littermates (white) and Jna/+ mutants (gray). Error bars show the SEM. Test of the interaction between genotype and the distribution of cells across bins were as follows: E12.5 (F[9,189] < 1; P > 0.05); E14.5 (F[9,198] = 4.75; P < 0.0001), and E16.5 (F[9,270] = 13.3; P < 0.0001). (J and K) BrdU-positive cells in the hippocampus of a littermate control (J) and Jna/+ mouse (K) following injection of BrdU at E14.5. Jna/+ mice show disorganization of BrdU-positive cells in Ammon's horn, affecting both CA1 and CA3 regions (arrowed). Scale bar shows 200 μm (J and K).
Figure 5
Figure 5
Abnormal Behavior in Jna/+ Mice (A) Total beam breaks, a measure of locomotor activity, for Jna/+ mice, wild-type littermates, mutant animals with the transgene (Jna/+/BAC), and the H41 transgenic line (BAC). Addition of the transgene alone has no effect on locomotor activity (F[1,16] < 1; P > 0.5) but rescues the hyperactive phenotype in Jna/+ mice. (B and C) In comparison to wild-type littermates, Jna/+ mice show impaired hippocampal-dependent working memory when assessed by discrete trial spontaneous (F[1,12] = 34.1; P < 0.0001) and rewarded alternation (F[1,12] = 29.84; P < 0.0005). (D) Jna/+ mice exhibit no deficits when assessed on a nonspatial reference memory task that relies on tactile discrimination. (E and F) Jna/+ mice show a low anxiety phenotype, entering the open arms of the elevated plus maze more often (F[1,15] = 17.7; P < 0.001) and the center of the open field sooner (F[1,16] = 46.7; P < 0.0001) than littermate controls. Error bars show the SEM.
Figure 6
Figure 6
Mutations in TUBA3 Cause Lissencephaly in Humans Screening of lissencephalic patients without mutations in DCX or LIS1 identified two individuals with spontaneous pathogenic mutations in TUBA3. (A and B) The sequencing traces for the father (♂), mother (♀), and affected patient (P) for these two individuals. In the first, a C to T substitution mutates an arginine residue to histidine (R402H), and, in the second, a G to A substitution mutates another arginine to cysteine (R264C). (C–E) The R402H patient shows severe lissencephaly. (F–H) The second individual exhibits less severe cortical abnormalities. (I and J) Both these residues are highly conserved in different species and isotypes of α-tubulin.
Figure 7
Figure 7
Mapping of the Mutations onto the α-Tubulin Structure (A) The structure of α-tubulin (pdb: 1JFF). The three mutations are highlighted as spheres in atomic coloring (nitrogen: blue; oxygen: red; carbon: yellow). The bound GTP molecule is shown as red sticks. (B) Close-up view of the GTP binding site of α-tubulin. Serine 140, located on the T4 loop, is depicted as a stick presentation in atomic coloring according to (A) with its solvent accessible surface shown as blue wire. The second panel shows a model of the S140G mutation, the red arrow indicating extra space generated by the mutation and potentially responsible for disrupting the interaction with GTP. (C) Schematic presentation of the tubulin:doublecortin complex based on a structural model from Moores (Moores et al., 2004). The position of arginine 402 (R402), located at the beginning of the H11-H12 loop, is highlighted with a circle (α-tubulin: salmon; β-tubulin: cyan; doublecortin: gray ellipse). (D) Cartoon presentation of the complex between tubulin and the kinesin KIF1A (pdb: 2HXF). KIF1A is colored in slate. The positions of arginine 264 (R264), located at the surface of the molecule at the loop between H8 and S7, and of argininine 402 (R402), are highlighted by circles.

Similar articles

Cited by

References

    1. Angevine J.B., Jr. Time of neuron origin in the hippocampal region. An autoradiographic study in the mouse. Exp. Neurol. 1965;(Suppl 2):1–70. - PubMed
    1. Bannerman D.M., Deacon R.M., Brady S., Bruce A., Sprengel R., Seeburg P.H., Rawlins J.N. A comparison of GluR-A-deficient and wild-type mice on a test battery assessing sensorimotor, affective, and cognitive behaviors. Behav. Neurosci. 2004;118:643–647. - PubMed
    1. Bartolini F., Bhamidipati A., Thomas S., Schwahn U., Lewis S.A., Cowan N.J. Functional overlap between retinitis pigmentosa 2 protein and the tubulin-specific chaperone cofactor C. J. Biol. Chem. 2002;277:14629–14634. - PubMed
    1. Basten C.J., Zeng Z.B., Weir B.S. Academic Press; San Diego: 1996. QTLCartographer: a suite of programs for mapping quantitative trait loci. Abstracts to Plant Genome, IV.
    1. Boycott K.M., Flavelle S., Bureau A., Glass H.C., Fujiwara T.M., Wirrell E., Davey K., Chudley A.E., Scott J.N., McLeod D.R., Parboosingh J.S. Homozygous deletion of the very low density lipoprotein receptor gene causes autosomal recessive cerebellar hypoplasia with cerebral gyral simplification. Am. J. Hum. Genet. 2005;77:477–483. - PMC - PubMed

Publication types

MeSH terms