. 2007 Mar 1;579(Pt 2):465-71.
doi: 10.1113/jphysiol.2006.127480. Epub 2007 Jan 11.

Molecular basis of the T- and L-type Ca2+ currents in canine Purkinje fibres

Affiliations

Molecular basis of the T- and L-type Ca2+ currents in canine Purkinje fibres

Barbara Rosati et al. J Physiol. .

Abstract

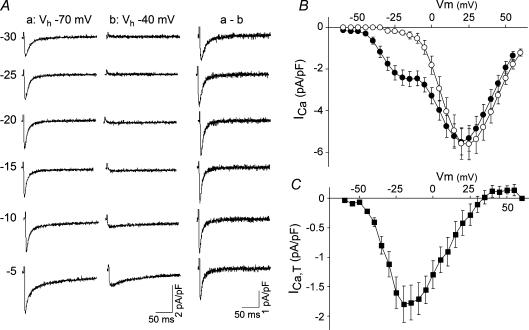
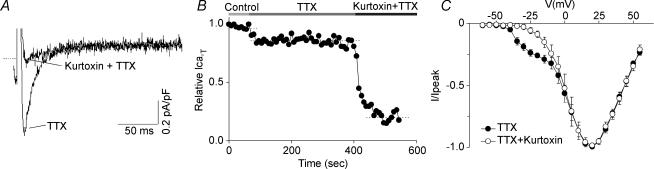
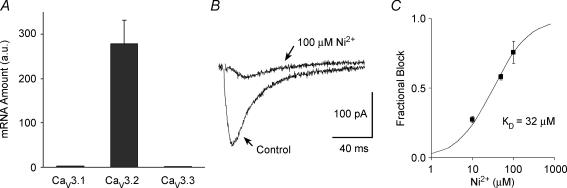
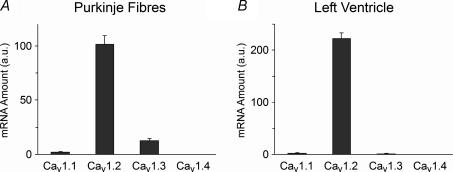
This study examines the molecular basis for the T-type and L-type Ca(2+) currents in canine Purkinje cells. The I(CaT) in Purkinje cells was completely suppressed by 200 nM kurtoxin, a specific blocker of both Ca(v)3.1 and Ca(v)3.2 channels. Since only Ca(v)3.2 mRNA is expressed at high levels in Purkinje fibres, being approximately 100-fold more abundant than either Ca(v)3.1 or Ca(v)3.3 mRNAs, it is concluded that the Ca(v)3.2 gene encodes the bulk of the T-type Ca(2+) channels in canine Purkinje cells. This conclusion is consistent with the sensitivity of the current to blockade by Ni(2+) ions (K(D) = 32 microM). For L-type channels, Ca(v)1.2 mRNA was most abundant in Purkinje fibres but a significant level of Ca(v)1.3 mRNA expression was also found. A comparison of the sensitivity to blockade by isradipine of the L-type currents in Purkinje cells and ventricular epicardial myocytes, which only express Ca(v)1.2, suggests that the Ca(v)1.3 channels make, at most, a minor contribution to the L-type current in canine Purkinje cells.


Figures

Figure 1
Figure 1. L- and T-type calcium currents in canine Purkinje cells
A, recordings of total calcium currents elicited in an isolated Purkinje cell in response to depolarizing voltage steps (values on the left of the corresponding traces), from holding potentials (Vh) of −70 (left column) or −40 mV (centre column), as indicated. Difference currents for each test pulse are shown in the right column (ab). B, current–voltage relationship for the total calcium current elicited from Vh of either −70 mV (•, n = 10 cells, mean ± s.e.m.) or −40 mV (○, n = 7 cells, mean ± s.e.m.). C, current–voltage relationship of the T-type current, as isolated by subtraction of the total current at Vh = −40 mV from the current recorded at Vh = −70 mV. Mean data ± s.e.m. (n = 7) are shown.
Figure 2
Figure 2. Effect of kurtoxin on the T-type calcium current in canine Purkinje cells
A, kurtoxin selectively blocks the T-type component of the calcium current in Purkinje cells. The current was elicited by a test pulse at −25 mV from a holding potential of −90 mV, in control conditions and after the application of 200 nm kurtoxin, as indicated. Both the control and drug recordings were performed in the presence of 20 μm TTX (see Methods for rationale). B, time course for the T-type calcium current inhibition by kurtoxin. The horizontal bars on top of the graph indicate the bath solution applied. C, average current–voltage plots obtained in n = 3 cells under control conditions and after application of kurtoxin (see legend). The holding potential was −70 mV and test pulses were applied from −60 to +55 mV at 5 mV intervals. Error bars represent the s.e.m.
Figure 3
Figure 3. Molecular basis of the T-type calcium current in canine Purkinje cells
A, bar graph of relative mRNA abundance for the Cav3.1, Cav3.2 and Cav3.3 genes in Purkinje fibres. The mRNA quantities were determined by real-time PCR and are represented in arbitrary units. Data are means ± s.e.m. (n = 4, each sample from 3 to 6 different hearts). B, sample recording of ICaT in a canine Purkinje cell, in control conditions (see Methods) and in the presence of 100 μm Ni2+, as indicated by the arrows. The current was elicited by a −30 mV test pulse from a holding potential of −90 mV. C, dose–response curve for Ni2+ blockade of ICaT. The fractional block of the ICaT is shown for three different Ni2+ concentrations: 10, 50 and 100 μm. Data points are average values obtained in n = 3 cells from 2 different hearts. Data points were fitted with the Hill equation (see Methods), yielding a KD of 32 ± 3 μm (mean ± s.e.m.).
Figure 4
Figure 4. Cav1 family gene expression in the canine Purkinje fibres and left ventricle
Bar graph of relative mRNA abundance for the Cav1.1, Cav1.2, Cav1.3 and Cav1.4 genes in Purkinje fibres (A) and left ventricle (B). The mRNA quantities were determined by real-time PCR and are represented in arbitrary units. Data are means ± s.e.m. (n = 3–5, each Purkinje sample from 3 to 6 hearts; each ventricular sample from 1 heart).

References

    1. Bohn G, Moosmang S, Conrad H, Ludwig A, Hofmann F, Klugbauer N. Expression of T- and L-type calcium channel mRNA in murine sinoatrial node. FEBS Lett. 2000;481:73–76. - PubMed
    1. Catterall WA, Perez-Reyes E, Snutch TP, Striessnig J. International Union of Pharmacology. XLVIII. Nomenclature and structure-function relationships of voltage-gated calcium channels. Pharmacol Rev. 2005;57:411–425. - PubMed
    1. Chuang RS, Jaffe H, Cribbs L, Perez-Reyes E, Swartz KJ. Inhibition of T-type voltage-gated calcium channels by a new scorpion toxin. Nat Neurosci. 1998;1:668–674. - PubMed
    1. Cole WC, Chartier D, Martin M, Leblanc N. Ca2+ permeation through Na+ channels in guinea pig ventricular myocytes. Am J Physiol Heart Circ Physiol. 1997;273:H128–H137. - PubMed
    1. Cribbs LL, Lee JH, Yang J, Satin J, Zhang Y, Daud A, Barclay J, Williamson MP, Fox M, Rees M, Perez-Reyes E. Cloning and characterization of α1H from human heart, a member of the T-type Ca2+ channel gene family. Circ Res. 1998;83:103–109. - PubMed

Publication types

MeSH terms

LinkOut - more resources