. 2007 Apr 1;580(Pt 1):171-9.
doi: 10.1113/jphysiol.2006.126888. Epub 2007 Jan 11.

The kinetics of inhibition of rat recombinant heteromeric alpha1beta glycine receptors by the low-affinity antagonist SR-95531

Affiliations

The kinetics of inhibition of rat recombinant heteromeric alpha1beta glycine receptors by the low-affinity antagonist SR-95531

Marco Beato et al. J Physiol. .

Abstract

The GABA(A) antagonist SR-95531 (gabazine) is known to block glycine receptors, albeit with low affinity. We have studied the effect of SR-95531 on rat recombinant alpha1beta glycine receptors expressed in human embryonic kidney (HEK293) cells by recording macroscopic currents elicited by rapid glycine application to outside-out patches. SR-95531 has a fast unbinding rate (k(offSR), about 3000 s(-1)) and this means that the time course of its unbinding is comparable to the expected time course of the transmitter in the cleft. We also found that equilibrium applications of SR-95531 reduced the response to brief glycine applications by an amount inversely proportional to the duration of glycine application. The fast unbinding rate of SR-95531 from the glycine receptor will make it useful for establishing the time course of glycine concentration at glycinergic synapses.


Figures

Figure 1
Figure 1. Kinetic scheme for the activation of heteromeric glycine receptors by saturating concentrations of glycine
A, shows the averaged current response of an outside-out patch to a 200 ms application of 3 mm glycine. The time course of glycine concentration (taken from the open tip potential recorded at the end of the experiment) is shown at the bottom of the trace in this and the following figures. B, continuous black line shows the fit to the data (formula image
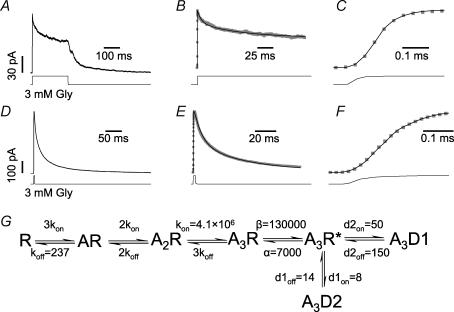
) obtained after optimizing the rate constants in the model shown in G. C, shows the response onset on an expanded timescale; note the good agreement of the fitted curve (black line) to the experimental inward current. D, shows the averaged current response to a short (3 ms) application of 3 mm glycine. The deactivation phase was empirically fitted with two exponentials (see Results). The data were fitted to the model in G with association and dissociation rate constants (kon and koff, respectively) as free parameters and the desensitization and resensitization rates fixed to the average values obtained from the fits of 200 ms steps. F, shows the rising phase of the trace and the fit of E on an expanded timescale (note the different sampling rate of 20 μs, instead of 40 μs as in C). G, the scheme was used to fit the data and shows the average of the rate constants fitted to the data from five patches (for the 200 ms steps) and six patches (for the 3 ms steps; units are s−1 or s−1 μm−1 as appropriate).
Figure 2
Figure 2. Schild analysis of the effect of co-application of SR-95531 (100, 300 and 500 μm) on whole-cell responses to glycine
A, C and E, show inward currents in response to approximately equipotent glycine concentrations with and without three different concentrations of antagonist. B, D and F, show the shifts in the glycine dose–response curves produced by these three antagonist concentrations and are the fits of two power functions (with the constraint of equal slopes) to the peak currents measured in each experiment. For each antagonist concentration the dose ratio (r) was calculated as the distance between the two parallel lines. G, the Schild plot uses the average dose ratio values from all recordings (plotted on a log–log scale versus the antagonist concentrations). The fit to the Schild equation (slope constrained to one) gave a value of equilibrium dissociation constant (KB) of 191 ± 8 μm (the number of cells at each concentration is indicated above each point).
Figure 3
Figure 3. The offset and onset of SR-95531 antagonism
A, shows the responses to 200 ms applications of 3 mm glycine with (grey trace) and without (black trace) pre-equilibration with SR-95531. The onset of desensitization is very similar in the two experimental conditions. B, the rise time of the current response is approximately 3-fold slower after pre-equilibration with SR-95531 (compare grey and black traces in). This is due to the progressive increase of available receptors as the antagonist washes out. C, shows the simultaneous fit of the rise time of the responses (with and without antagonist) to the model of Fig. 4D with only the unbinding rate of SR-95531 (koffSR) as a free variable and the association rate constant konSR constrained to give a value of equilibrium dissociation constant (KB) of 200 μm. D, shows the response to 40 μm glycine (average of 50 individual traces). Once a steady level of current in response to glycine was reached, 288 μm SR-95531 was co-applied with glycine (see bars below the traces). Note that because of the technical limitations of the theta tube application (i.e. the number of barrels available), the onset of glycine application was obtained by manually switching on glycine perfusion, whereas the transition to glycine + antagonist is a true concentration jump. The current decreased to 15% of its control value and the onset of the antagonist effect was fitted to the model of Fig. 4D with konSR as the only free variable. E, the fit (black line) is shown on an expanded timescale superimposed on the data (grey trace). F, histogram shows the percentage reduction in the peak current elicited by 200 ms or 3 ms steps to 3 mm glycine after pre-equilibration with 1 mm SR-95531 and the reduction induced by 288 μm SR-95531 co-applied with 40 μm glycine.
Figure 4
Figure 4. Inhibition of responses to short glycine pulses by equilibrium application of SR-95531
A and B, show two examples of responses to 3 mm glycine before (black trace) and during (grey trace) steady-state application of 288 μm antagonist. There is a consistent increase in the rise time of the response (see insets), but the percentage inhibition of the peak is different in the two cases. This is correlated with the actual length of the glycine concentration pulse, which is shorter in A (∼1 ms) than in B (∼1.6 ms). C, this is shown for seven experiments in which the actual length of the pulse was plotted against the percentage reduction of peak current in the presence of SR-95531 (formula image
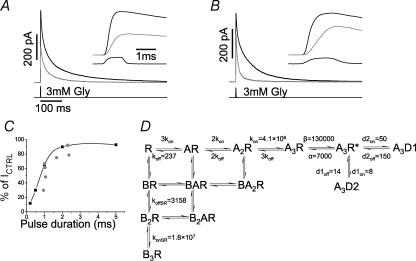
). The prediction of the response to square pulses of glycine of variable duration are shown in the same graph (▪; joined by cubic splines for clarity). D, gives a summary of the values of the rate constants fitted from the different experimental protocols.

References

    1. Arunlakshana O, Schild HO. Some quantitative uses of drug antagonists. Br J Pharmacol. 1959;14:48–58. - PMC - PubMed
    1. Benveniste M, Mayer ML. Kinetic analysis of antagonist action at NMDA receptors: two binding sites each for glutamate and glycine. Biophys J. 1991;59:560–573. - PMC - PubMed
    1. Burzomato V, Beato M, Groot-Kormelink PJ, Colquhoun D, Sivilotti LG. Single-channel behavior of heteromeric α1β glycine receptors: an attempt to detect a conformational change before the channel opens. J Neuroscience. 2004;24:10924–10940. - PMC - PubMed
    1. Burzomato V, Groot-Kormelink PJ, Sivilotti LG, Beato M. Stoichiometry of recombinant heteromeric glycine receptors revealed by a pore-lining region point mutation. Recept Channels. 2003;9:353–361. - PubMed
    1. Clements JD, Lester RAJ, Tong G, Jahr CE, Westbrook GL. The time course of glutamate in the synaptic cleft. Science. 1992;258:1498–1501. - PubMed

Publication types