

Alterations in mRNA expression and protein products following spinal cord injury in humans
- PMID: 17218363
- PMCID: PMC2151363
- DOI: 10.1113/jphysiol.2006.118042
Alterations in mRNA expression and protein products following spinal cord injury in humans
Abstract
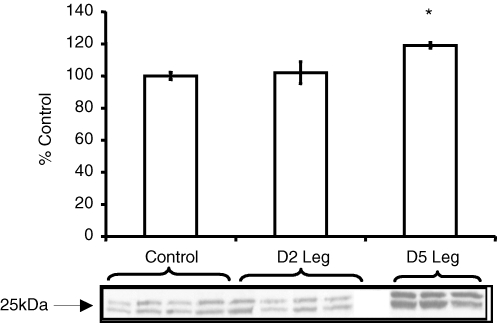
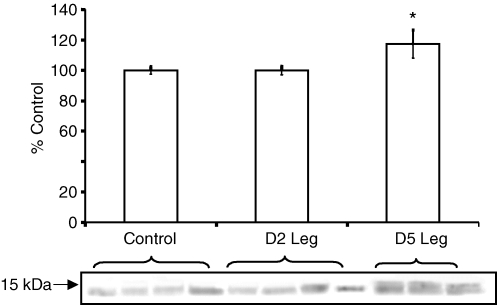
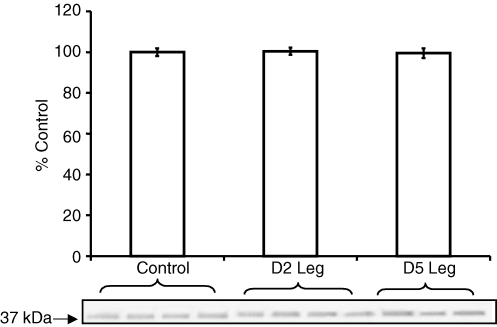
We examined the effects of spinal cord injury (SCI) on alterations in gene expression and respective protein products in human skeletal muscle 2 days and 5 days post-SCI. Biopsies were taken from skeletal muscle of 9 men and 1 woman (n = 10) (43.9 +/- 6.7 years) 2 days and 5 days post-SCI and from 5 healthy young men who served as controls (20.4 +/- 0.5 years). Global changes in gene expression were analysed using Affymetrix GeneChips on a subsample of subjects (n = 3). Candidate genes were then pursued via qRT-PCR. Western blotting (WB) was used to quantify protein products of candidate genes. Immunohistochemistry (IHC) was used to localize proteins. Groups of transcripts showing the greatest percentage of altered expression, the most robust fold-changes, and indicative of involvement of an entire pathway using the GeneChip included genes involved in the ubiquitin proteasome pathway (UPP), metallothionein function, and protease inhibition. qRT-PCR analysis confirmed increases in gene expression for UPP components (UBE3C, Atrogin-1, MURF1, and PSMD11), the metallothioneins (MT1A, MT1F, MT1H), and the protease inhibitor, SLPI (P < 0.05) at 2 days and 5 days post-SCI. Protein levels of the proteasome subunit (PSMD11) and the metallothioneins were increased 5 days post-SCI. Protein levels of UBE3C, Atrogin-1, MURF1 and SLPI were unchanged (P > 0.05). IHC showed increased staining for PSMD11 and the metallothioneins 5 days post-SCI, along the peripheral region of the cells. IHC also showed altered staining for Atrogin-1 at 5 days post-SCI along the membrane region. Thus, there was a profound increase in gene expression of UPP components, the metallothioneins, and the protease inhibitor, SLPI, within 5 days of SCI. Increased protein levels for PSMD11 and the metallothioneins 5 days post-SCI, specifically along the cell periphery, indicate that proteins in this region may be early targets for degradation post-SCI.
Figures


Comment in
-
When size really does matter.J Physiol. 2007 Mar 15;579(Pt 3):567. doi: 10.1113/jphysiol.2007.128546. Epub 2007 Feb 8. J Physiol. 2007. PMID: 17289781 Free PMC article. Review. No abstract available.
-
From animals to humans: evidence linking oxidative stress as a causative factor in muscle atrophy.J Physiol. 2007 Sep 1;583(Pt 2):421-2. doi: 10.1113/jphysiol.2007.139378. Epub 2007 Jul 19. J Physiol. 2007. PMID: 17640928 Free PMC article. No abstract available.
References
-
- Apostolova MD, Ivanova IA, Cherian MG. Metallothionein and apoptosis during differentiation of myoblasts to myotubes: protection against free radical toxicity. Toxicol Appl Pharmacol. 1999;159:175–184. - PubMed
-
- Attaix D, Aurousseau E, Combaret L, Kee A, Larbaud D, Ralliere C, Souweine B, Taillandier D, Tilignac T. Ubiquitin-proteasome-dependent proteolysis in skeletal muscle. Reprod Nutr Dev. 1998;38:153–165. - PubMed
-
- Bassaglia Y, Cebrian J, Covan S, Garcia M, Foucrier J. Proteasomes are tightly associated to myofibrils in mature skeletal muscle. Exp Cell Res. 2005;302:221–232. - PubMed
-
- Batt J, Bain J, Goncalves J, Michalski B, Plant P, Fahnestock M, Woodgett J. Differential gene expression profiling of short and long term denervated muscle. FASEB J. 2006;20:115–117. - PubMed
-
- Bodine SC, Latres E, Baumhueter S, Lai VK, Nunez L, Clarke BA, Poueymirou WT, Panaro FJ, Na E, Dharmarajan K, Pan ZQ, Valenzuela DM, DeChiara TM, Stitt TN, Yancopoulos GD, Glass DJ. Identification of ubiquitin ligases required for skeletal muscle atrophy. Science. 2001;294:1704–1708. - PubMed
Publication types
MeSH terms
Substances
LinkOut - more resources
Full Text Sources
Medical