

Classical versus stochastic kinetics modeling of biochemical reaction systems
- PMID: 17218456
- PMCID: PMC1864832
- DOI: 10.1529/biophysj.106.093781
Classical versus stochastic kinetics modeling of biochemical reaction systems
Abstract
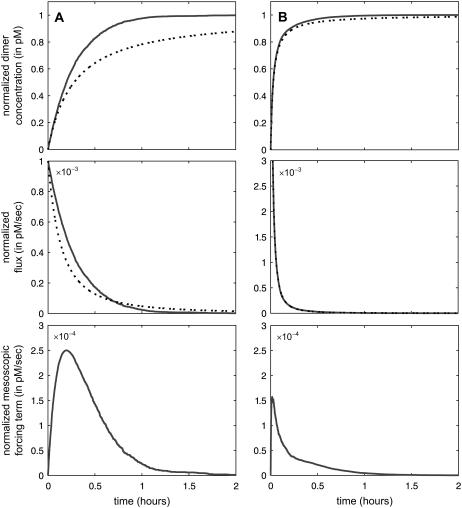
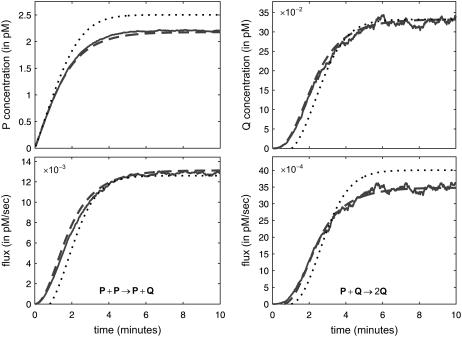
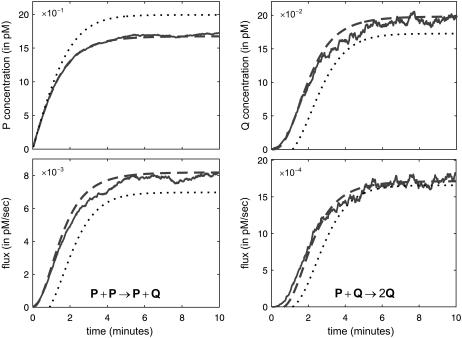
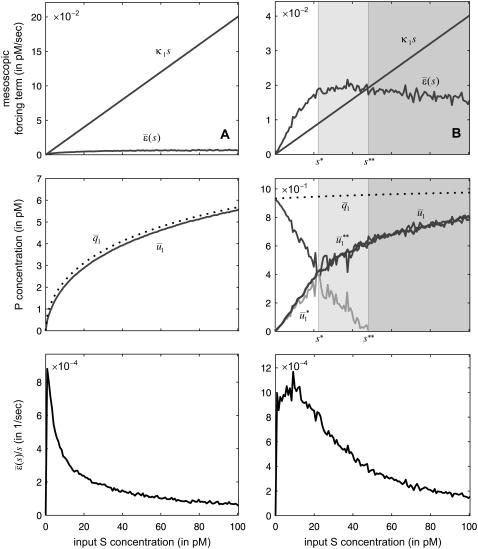
We study fundamental relationships between classical and stochastic chemical kinetics for general biochemical systems with elementary reactions. Analytical and numerical investigations show that intrinsic fluctuations may qualitatively and quantitatively affect both transient and stationary system behavior. Thus, we provide a theoretical understanding of the role that intrinsic fluctuations may play in inducing biochemical function. The mean concentration dynamics are governed by differential equations that are similar to the ones of classical chemical kinetics, expressed in terms of the stoichiometry matrix and time-dependent fluxes. However, each flux is decomposed into a macroscopic term, which accounts for the effect of mean reactant concentrations on the rate of product synthesis, and a mesoscopic term, which accounts for the effect of statistical correlations among interacting reactions. We demonstrate that the ability of a model to account for phenomena induced by intrinsic fluctuations may be seriously compromised if we do not include the mesoscopic fluxes. Unfortunately, computation of fluxes and mean concentration dynamics requires intensive Monte Carlo simulation. To circumvent the computational expense, we employ a moment closure scheme, which leads to differential equations that can be solved by standard numerical techniques to obtain more accurate approximations of fluxes and mean concentration dynamics than the ones obtained with the classical approach.
Figures
Similar articles
-
Biochemical networks with uncertain parameters.Syst Biol (Stevenage). 2005 Sep;152(3):97-107. doi: 10.1049/ip-syb:20045033. Syst Biol (Stevenage). 2005. PMID: 16986274
-
A markov model based analysis of stochastic biochemical systems.Comput Syst Bioinformatics Conf. 2007;6:121-32. Comput Syst Bioinformatics Conf. 2007. PMID: 17951818
-
Analytic methods for modeling stochastic regulatory networks.Methods Mol Biol. 2012;880:273-322. doi: 10.1007/978-1-61779-833-7_13. Methods Mol Biol. 2012. PMID: 23361990 Review.
-
Mass fluctuation kinetics: capturing stochastic effects in systems of chemical reactions through coupled mean-variance computations.J Chem Phys. 2007 Jan 14;126(2):024109. doi: 10.1063/1.2408422. J Chem Phys. 2007. PMID: 17228945
-
Stochastic P systems and the simulation of biochemical processes with dynamic compartments.Biosystems. 2008 Mar;91(3):458-72. doi: 10.1016/j.biosystems.2006.12.009. Epub 2007 Jul 17. Biosystems. 2008. PMID: 17728055 Review.
Cited by
-
Intercellular Variability in Protein Levels from Stochastic Expression and Noisy Cell Cycle Processes.PLoS Comput Biol. 2016 Aug 18;12(8):e1004972. doi: 10.1371/journal.pcbi.1004972. eCollection 2016 Aug. PLoS Comput Biol. 2016. PMID: 27536771 Free PMC article.
-
Frequency spectra and the color of cellular noise.Nat Commun. 2022 Jul 25;13(1):4305. doi: 10.1038/s41467-022-31263-x. Nat Commun. 2022. PMID: 35879291 Free PMC article.
-
Using entropy-driven amplifier circuit response to build nonlinear model under the influence of Lévy jump.BMC Bioinformatics. 2022 Jan 20;22(Suppl 12):437. doi: 10.1186/s12859-021-04331-0. BMC Bioinformatics. 2022. PMID: 35057730 Free PMC article.
-
Enhanced identification and exploitation of time scales for model reduction in stochastic chemical kinetics.J Chem Phys. 2008 Dec 28;129(24):244112. doi: 10.1063/1.3050350. J Chem Phys. 2008. PMID: 19123500 Free PMC article.
-
Fluctuations and the rate-limiting step of peptide-induced membrane leakage.Biophys J. 2010 Sep 22;99(6):1791-800. doi: 10.1016/j.bpj.2010.07.010. Biophys J. 2010. PMID: 20858423 Free PMC article.
References
-
- Heinrich, R., and S. Schuster. 1996. The Regulation of Cellular Systems. Chapman and Hall, New York.
-
- McAdams, H. H., and A. Arkin. 1999. It's a noisy business! Genetic regulation at the nanomolar scale. Trends Genet. 15:65–69. - PubMed
-
- Rao, C. V., D. M. Wolf, and A. P. Arkin. 2002. Control, exploitation and tolerance of intracellular noise. Nature. 420:231–237. - PubMed
-
- Kaern, M., T. C. Elston, W. J. Blake, and J. J. Collins. 2005. Stochasticity in gene expression: from theories to phenotypes. Nat. Rev. Genet. 6:451–464. - PubMed
Publication types
MeSH terms
Substances
LinkOut - more resources
Full Text Sources
