

How alcohol chain-length and concentration modulate hydrogen bond formation in a lipid bilayer
- PMID: 17218462
- PMCID: PMC1864837
- DOI: 10.1529/biophysj.106.097022
How alcohol chain-length and concentration modulate hydrogen bond formation in a lipid bilayer
Abstract
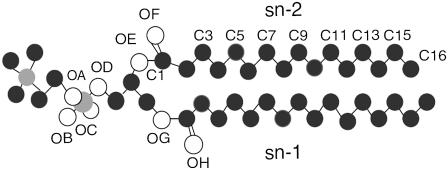
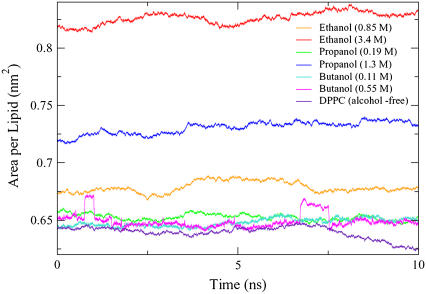
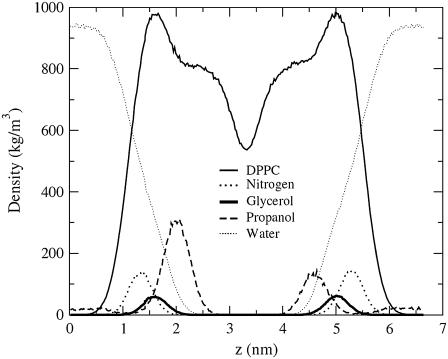
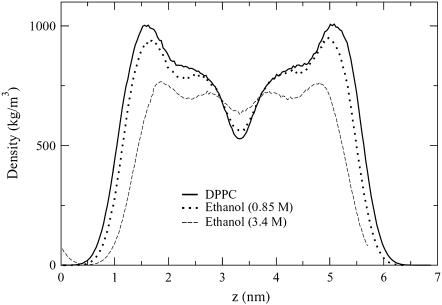
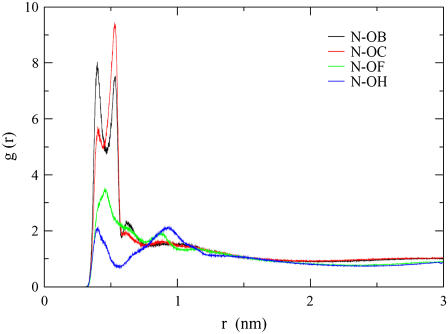
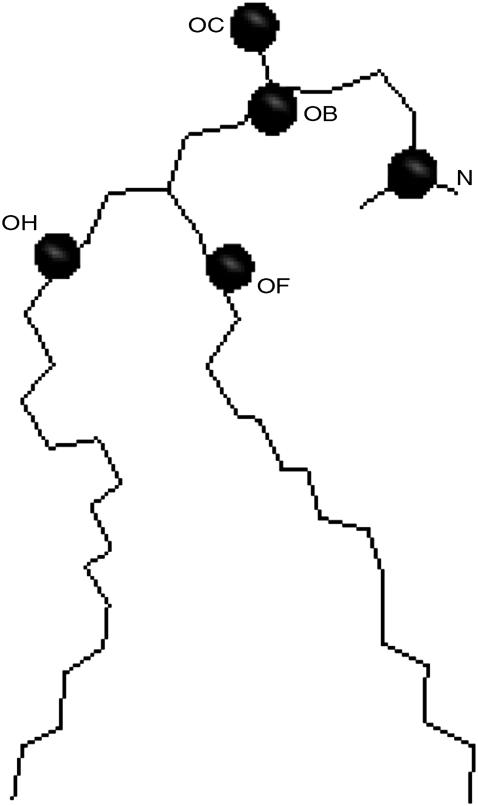
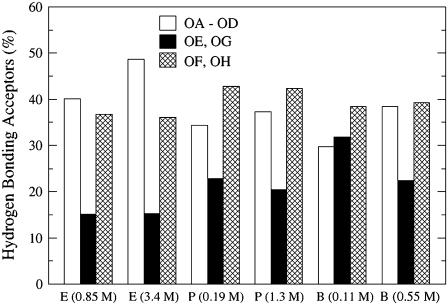
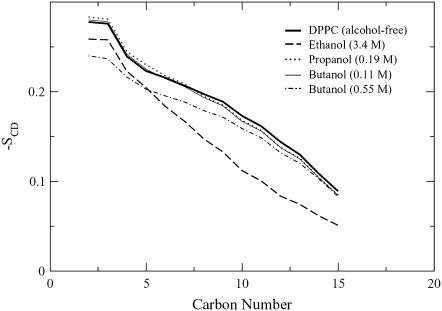
Molecular dynamics simulations are used to measure the change in properties of a hydrated dipalmitoylphosphatidylcholine bilayer when solvated with ethanol, propanol, and butanol solutions. There are eight oxygen atoms in dipalmitoylphosphatidylcholine that serve as hydrogen bond acceptors, and two of the oxygen atoms participate in hydrogen bonds that exist for significantly longer time spans than the hydrogen bonds at the other six oxygen atoms for the ethanol and propanol simulations. We conclude that this is caused by the lipid head group conformation, where the two favored hydrogen-bonding sites are partially protected between the head group choline and the sn-2 carbonyl oxygen. We find that the concentration of the alcohol in the ethanol and propanol simulations does not have a significant influence on the locations of the alcohol/lipid hydrogen bonds, whereas the concentration does impact the locations of the butanol/lipid hydrogen bonds. The concentration is important for all three alcohol types when the lipid chain order is examined, where, with the exception of the high-concentration butanol simulation, the alcohol molecules having the longest hydrogen-bonding relaxation times at the favored carbonyl oxygen acceptor sites also have the largest order in the upper chain region. The lipid behavior in the high-concentration butanol simulation differs significantly from that of the other alcohol concentrations in the order parameter, head group rotational relaxation time, and alcohol/lipid hydrogen-bonding location and relaxation time. This appears to be the result of the system being very near to a phase transition, and one occurrence of lipid flip-flop is seen at this concentration.
Figures
Similar articles
-
Under the influence of alcohol: the effect of ethanol and methanol on lipid bilayers.Biophys J. 2006 Feb 15;90(4):1121-35. doi: 10.1529/biophysj.105.062364. Epub 2005 Dec 2. Biophys J. 2006. PMID: 16326895 Free PMC article.
-
Sensitivity of hydrogen bond lifetime dynamics to the presence of ethanol at the interface of a phospholipid bilayer.J Phys Chem B. 2006 Mar 2;110(8):3791-7. doi: 10.1021/jp054275i. J Phys Chem B. 2006. PMID: 16494438
-
Molecular simulation study of structural and dynamic properties of mixed DPPC/DPPE bilayers.Biophys J. 2006 Jun 1;90(11):3951-65. doi: 10.1529/biophysj.105.076596. Epub 2006 Mar 13. Biophys J. 2006. PMID: 16533838 Free PMC article.
-
Molecular simulation study of phospholipid bilayers and insights of the interactions with disaccharides.Biophys J. 2003 Nov;85(5):2830-44. doi: 10.1016/s0006-3495(03)74706-7. Biophys J. 2003. PMID: 14581188 Free PMC article.
-
Molecular dynamics simulation of a palmitoyl-oleoyl phosphatidylserine bilayer with Na+ counterions and NaCl.Biophys J. 2004 Mar;86(3):1601-9. doi: 10.1016/S0006-3495(04)74227-7. Biophys J. 2004. PMID: 14990486 Free PMC article.
Cited by
-
Understanding the Molecular Mechanism of Anesthesia: Effect of General Anesthetics and Structurally Similar Non-Anesthetics on the Properties of Lipid Membranes.J Phys Chem B. 2023 Jul 13;127(27):6078-6090. doi: 10.1021/acs.jpcb.3c02976. Epub 2023 Jun 27. J Phys Chem B. 2023. PMID: 37368412 Free PMC article.
-
Simulations of Biomembranes and Water: Important Technical Aspects.Fluid Phase Equilib. 2007 Dec 1;261(1-2):18-25. doi: 10.1016/j.fluid.2007.07.056. Fluid Phase Equilib. 2007. PMID: 19050734 Free PMC article.
-
High-Throughput Simulations Reveal Membrane-Mediated Effects of Alcohols on MscL Gating.J Am Chem Soc. 2017 Feb 22;139(7):2664-2671. doi: 10.1021/jacs.6b11091. Epub 2017 Feb 10. J Am Chem Soc. 2017. PMID: 28122455 Free PMC article.
-
Designed Fabrication of Phloretin-Loaded Propylene Glycol Binary Ethosomes: Stability, Skin Permeability and Antioxidant Activity.Molecules. 2023 Dec 21;29(1):66. doi: 10.3390/molecules29010066. Molecules. 2023. PMID: 38202649 Free PMC article.
-
In vitro and in vivo models of acute alcohol exposure.World J Gastroenterol. 2009 Mar 14;15(10):1168-77. doi: 10.3748/wjg.15.1168. World J Gastroenterol. 2009. PMID: 19291816 Free PMC article. Review.
References
-
- Glinski, J., G. Chavepeyer, J. Platten, and P. Smet. 1998. Surface properties of diluted aqueous solutions of normal short-chained alcohols. J. Chem. Phys. 109:5050–5053.
-
- Franks, N., and W. Lieb. 1982. Molecular mechanisms of general anesthesia. Nature. 300:487–493. - PubMed
Publication types
MeSH terms
Substances
Grants and funding
LinkOut - more resources
Full Text Sources
