. 2007 Apr 1;92(7):2422-33.
doi: 10.1529/biophysj.106.100107. Epub 2007 Jan 11.

Investigation of domain formation in sphingomyelin/cholesterol/POPC mixtures by fluorescence resonance energy transfer and Monte Carlo simulations

Affiliations

Investigation of domain formation in sphingomyelin/cholesterol/POPC mixtures by fluorescence resonance energy transfer and Monte Carlo simulations

Monica L Frazier et al. Biophys J. .

Abstract

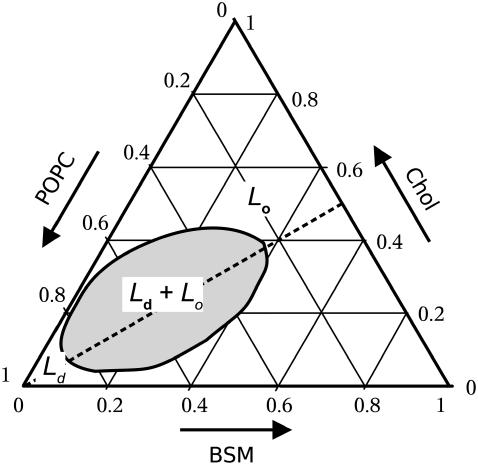
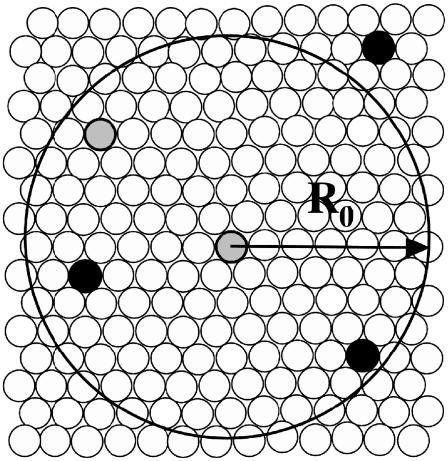
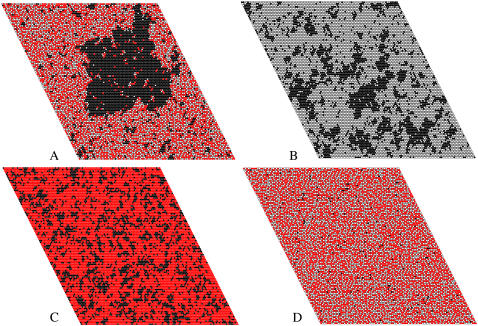
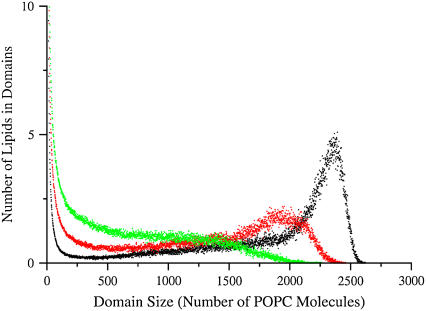
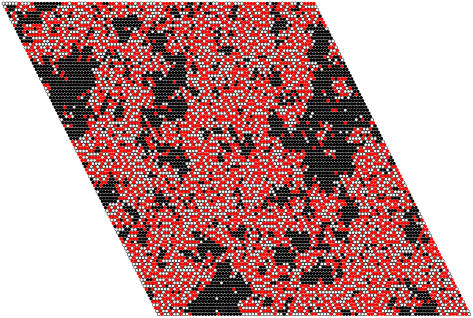
We have recently proposed a phase diagram for mixtures of porcine brain sphingomyelin (BSM), cholesterol (Chol), and 1-palmitoyl-2-oleoyl-phosphatidylcholine (POPC) on the basis of kinetics of carboxyfluorescein efflux induced by the amphipathic peptide delta-lysin. Although that study indicated the existence of domains, phase separations in the micrometer scale have not been observed by fluorescence microscopy in BSM/Chol/POPC mixtures, though they have for some other sphingomyelins (SM). Here we examine the same BSM/Chol/POPC system by a combination of fluorescence resonance energy transfer (FRET) and Monte Carlo simulations. The results clearly demonstrate that domains are formed in this system. Comparison of the FRET experimental data with the computer simulations allows the estimate of lipid-lipid interaction Gibbs energies between SM/Chol, SM/POPC, and Chol/POPC. The latter two interactions are weakly repulsive, but the interaction between SM and Chol is favorable. Furthermore, those three unlike lipid interaction parameters between the three possible lipid pairs are sufficient for the existence of a closed loop in the ternary phase diagram, without the need to involve multibody interactions. The calculations also indicate that the largest POPC domains contain several thousand lipids, corresponding to linear sizes of the order of a few hundred nanometers.


Figures

FIGURE 1
FIGURE 1
Simplified phase diagram for a ternary mixture of BSM/Chol/POPC at ∼25°C, based on kinetics of peptide/membrane interactions (1). The approximate location of the Ld/Lo coexistence region is shown in gray. Detailed diagrams have been published for a few mixtures (–3). Most of these diagrams show a central two-phase, Ld/Lo coexistence region, which in some systems appears more complicated because of the presence of adjacent regions containing solid phases (1,2).
FIGURE 2
FIGURE 2
Schematic representation of the definition of the Monte Carlo lattice and the Förster distance R0. Open circles represent lattice sites (lipids: BSM, POPC, or Chol). Solid circles represent FRET acceptors (NBD-POPE) and gray circles represent FRET donors (MB-POPE). Energy transfer is considered to occur if an acceptor is found within the radius R0 of a donor. The proportion of probes to lipids represented is about the same as used in the experiments and in the simulations.
FIGURE 3
FIGURE 3
Absorption and fluorescence emission spectra of MB-POPE and NBD-POPE. Absorption spectra were recorded in methanol (alkaline solution for MB-POPE). Emission spectra were recorded in aqueous buffer at pH 7.5, in POPC vesicles (100 μM) containing 10 mol % of either fluorescent probe. The gray lines correspond to the absorption (dashed) and emission (solid) spectra of MB-POPE. The black lines correspond to the absorption (dashed) and emission (solid) spectra of NBD-POPE.
FIGURE 4
FIGURE 4
Experimental calibration of the energy transfer efficiency (Et) with the NBD/MB peak ratio (pr). For the calculation of peak ratios the intensities were read at 524 nm for NBD and 460 nm for MB (peak maxima). The FRET Et was calculated from the intensity ratios of the MB peaks in samples containing both probes to identical samples containing only MB-POPE. These measurements were performed in a variety of lipid vesicles with different compositions and probe contents varying from 0.2 to 2 mol % relative to the total lipid. The different symbols correspond to experiments in the following lipid systems: POPC, open squares, solid diamonds, and solid triangles down; POPS, solid circles and open triangles; BSM/Chol/POPC 3:3:4, open circles; and BSM/Chol/POPC 4:4:2, solid triangles up. All points fall on the same curve, regardless of lipid composition and probe content of the vesicles. This curve can be empirically defined by the equation formula image, which is represented by the solid line.
FIGURE 5
FIGURE 5
Dependence of Et on the mol % of probe (MB-POPE) in LUVs of POPC (open triangles) and POPS (solid triangles). For POPC with 0.5 mol % MB-POPE three additional experiments are shown (diamonds) to convey the type of variance typically found in the experimental data. The acceptor/donor ratio is always NBD/MB = 1.5. The line represents the Monte Carlo simulation results calculated at 0.25, 0.5, 1.0, and 2.0 mol % MB-POPE, which are the same probe concentrations used in the experiments. The only adjustable parameter in the simulations is the experimental value of R0 = 46 Å, which corresponds in the lattice to R0 = 6 lipids for FRET within the same leaflet of the bilayer, or a projected value R0 = 2 lipids for FRET across the bilayer.
FIGURE 6
FIGURE 6
Dependence of Et on XPOPC in LUVs of BSM/Chol/POPC with compositions 45:45:10, 40:40:20, 30:30:40, 20:20:60, 10:10:80, and pure POPC (triangles). Each data point shown is the average of two independent samples and the error bars are the corresponding standard deviations (in one case, hidden in the symbol). The MB-POPE probe concentrations are always 1 mol % of the POPC content and the ratio NBD/MB = 1.5. The solid line represents the Monte Carlo simulation results calculated for the same lipid compositions and probe concentrations, using the parameters ωSC = −350, ωSP = 300, and ωCP = 200 cal/mol. The dashed line corresponds to a calculation where ωSP was changed to 250 cal/mol. The dotted line in Fig. 6 is the same calculation as the line in Fig. 5, corresponding to pure POPC, where no domains exist.
FIGURE 7
FIGURE 7
Representative series of spectra recorded in one experiment where the POPC mole fraction was varied in BSM/Chol/POPC mixtures, while keeping an equimolar ratio of BSM/Chol. (A) XPOPC = 0.20, (B) 0.40, (C) 0.60, (D) 0.80, and (E) pure POPC. All spectra A–E are shown on the same vertical scale and contain 0.5 mol % MB-POPE and 0.75 mol % NBD-POPE (NBD/MB = 1.5). For reference, (F) shows the spectrum of a sample containing only donors (MB-POPE). The vertical scale in (F) is ∼3× larger than in the other spectra, that is, the MB peak in (F) is really ∼3× larger. The total lipid concentrations are the same in all samples (100 μM).
FIGURE 8
FIGURE 8
Dependence of Et on XPOPC in LUVs of BSM/Chol/POPC. FRET experiments (solid circles) were performed on vesicles with the following compositions, all of which have equimolar mixtures of SM and Chol (letters in parenthesis correspond to the panels in Fig. 7): SM/Chol/POPC 40:40:20 (A), 35:35:30, 30:30:40 (B), 25:25:50, 20:20:60 (C), 10:10:80 (D), and pure POPC (E). The MB-POPE probe concentrations are kept fixed at 0.5 mol % of the total lipid, and the ratio NBD/MB = 1.5. Each point represents the average of three independent experiments (two for XPOPC = 0.30 and 0.50) and the error bars are the standard deviations. The solid line represents the Monte Carlo simulation results calculated for the same lipid compositions and probe concentrations, using the parameters ωSC = −350, ωSP = 300, and ωCP = 200 cal/mol. The dashed line corresponds to a calculation where ωSP was changed to 250 cal/mol.
FIGURE 9
FIGURE 9
Snapshot of one monolayer of an equilibrated Monte Carlo simulation of (A) SM/Chol/POPC 35:35:30, (B) SM/POPC 70:30, (C) Chol/POPC 70:30, and (D) SM/Chol 50:50. POPC molecules are represented by the black lattice sites, Chol molecules are represented by the red sites, and SM molecules are represented by the white sites. The lattice size was 100 × 100 (10,000 lipids) and the lipid-lipid interaction parameters were ωSC = −350, ωSP = +300, and ωCP = +200 cal/mol in this simulation. In (D) the few black sites are the probes.
FIGURE 10
FIGURE 10
Distribution of domain sizes in a Monte Carlo simulation on a 100 × 100 lattice. Clusters of ≥2 POPC sites are counted in the distribution. The unlike, lipid-lipid interaction parameters are ωSC = −350 cal/mol, ωCP = +200 cal/mol, and ωSP varied: 300 cal/mol (black), 270 cal/mol (red), and 250 cal/mol (green).
FIGURE 11
FIGURE 11
Snapshot of one monolayer of an equilibrated Monte Carlo simulation of SM/Chol/POPC 35:35:30. Notation and parameters are as in Fig. 9, except that ωSP = +250 cal/mol, reduced by 50 cal/mol relative to the simulation of Fig. 9 A, with which this snapshot should be compared.

References

    1. Pokorny, A., L. E. Yandek, A. I. Elegbede, A. Hinderliter, and P. F. F. Almeida. 2006. Temperature and composition dependence of the interaction of δ-lysin with ternary mixtures of sphingomyelin/cholesterol/POPC. Biophys. J. 91:2184–2197. - PMC - PubMed
    1. de Almeida, R. F. M., A. Fedorov, and M. Prieto. 2003. Sphingomyelin/phosphatidylcholine/cholesterol phase diagram: boundaries and composition of lipid rafts. Biophys. J. 85:2406–2416. - PMC - PubMed
    1. Veatch, S. L., and S. L. Keller. 2005. Miscibility phase diagrams of giant vesicles containing sphingomyelin. Phys. Rev. Lett. 94:148101. - PubMed
    1. McConnel, H. 2005. Complexes in ternary cholesterol–phospholipid mixtures. Biophys. J. 88:L23–L25. - PMC - PubMed
    1. Elliott, R., I. Szleifer, and M. Schick. 2006. Phase diagram of a ternary mixture of cholesterol and saturated and unsaturated lipids calculated from a microscopic model. Phys. Rev. Lett. 96:098101. - PubMed

Publication types