. 2007 Feb;117(2):407-18.
doi: 10.1172/JCI29539. Epub 2007 Jan 11.

Wiskott-Aldrich syndrome protein is required for regulatory T cell homeostasis

Affiliations

Wiskott-Aldrich syndrome protein is required for regulatory T cell homeostasis

Stephanie Humblet-Baron et al. J Clin Invest. 2007 Feb.

Abstract

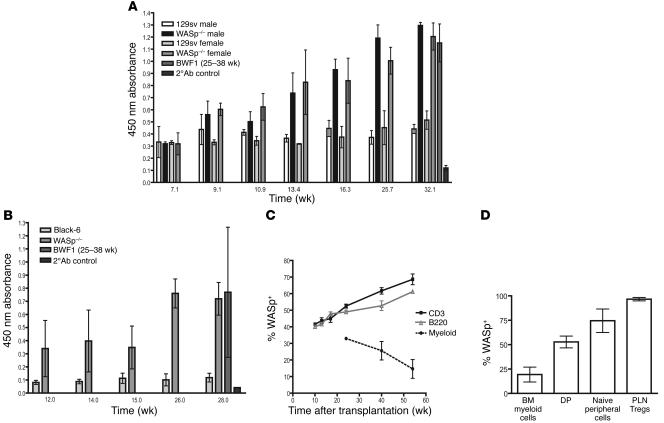
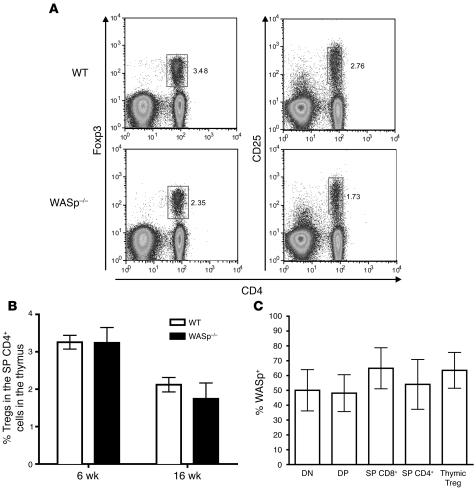
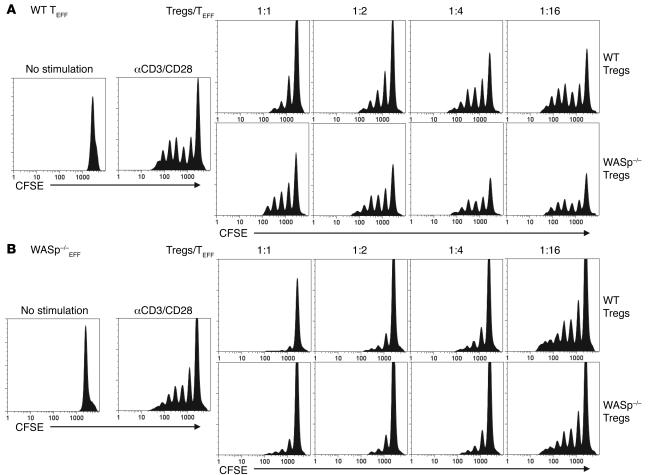
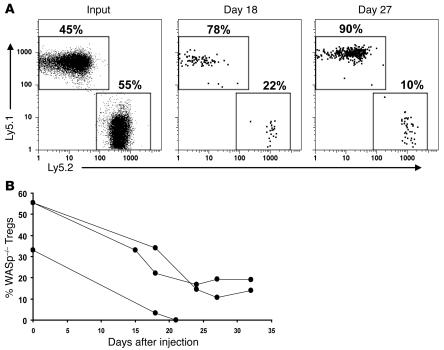
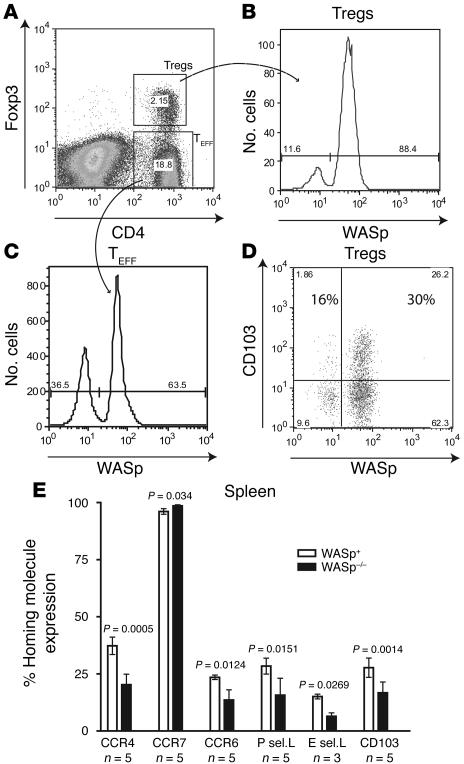
Wiskott-Aldrich syndrome protein (WASp) is essential for optimal T cell activation. Patients with WAS exhibit both immunodeficiency and a marked susceptibility to systemic autoimmunity. We investigated whether alterations in Treg function might explain these paradoxical observations. While WASp-deficient (WASp(-/-)) mice exhibited normal thymic Treg generation, the competitive fitness of peripheral Tregs was severely compromised. The total percentage of forkhead box P3-positive (Foxp3(+)) Tregs among CD4(+) T cells was reduced, and WASp(-/-) Tregs were rapidly outcompeted by WASp(+) Tregs in vivo. These findings correlated with reduced expression of markers associated with self-antigen-driven peripheral Treg activation and homing to inflamed tissue. Consistent with these findings, WASp(-/-) Tregs showed a reduced ability to control aberrant T cell activation and autoimmune pathology in Foxp3(-/-)Scurfy (sf) mice. Finally, WASp(+) Tregs exhibited a marked selective advantage in vivo in a WAS patient with a spontaneous revertant mutation, indicating that altered Treg fitness likely explains the autoimmune features in human WAS.


Figures

Figure 1
Figure 1. WT Tregs are expanded in a WAS patient following reversion of a pathogenic mutation.
Peripheral blood mononuclear cells were analyzed by flow cytometry using antibodies to CD4, CD45RA, CD27, CD62L, WASp, and FOXP3. (A) Characterization of the CD4+FOXP3+ (Tregs) and CD4+FOXP3 (effector T cell [TEFF]) cell populations within the total lymphocyte gate. (B) WASp expression within the CD4+FOXP3+ Treg population demonstrating that approximately 25% of the patient’s Tregs are WASp+. (C) Identification of the naive CD4+CD27+CD45RA+ T cells within the CD4+FOXP3 TEFF cell population. Naive cells account for approximately 7% of the TEFF population in this patient. (D) Within the naive T cell compartment, only a small proportion of the cells (approximately 2%) are WASp+. (E) In comparison with the TEFF population, very few (<1%) CD27+CD45RA+ naive cells are present within the CD4+FOXP3+ Treg population. (F and G) Within the CD4+FOXP3+ Treg population, WASp+ cells account for equal percentages of the CD62L+ (F) and CD62L (G) Treg subsets.
Figure 2
Figure 2. WASp–/– mice develop high-titer autoantibodies, and WT Tregs expand and rescue transplanted WASp–/– mice from autoimmune colitis.
Presence of IgG dsDNA autoantibodies in the serum of (A) 129SvEv (129sv) or (B) C57BL/6 (Black-6) WASp–/– mice versus age- and sex-matched WT controls or 25- to 38-week-old BWF1 mice (positive control). Antibody titers were assessed by ELISA (n = 3–6 animals for each strain/sex). 2°Ab control, background values obtained using secondary antibody alone. Error bars represent SD. (C) WASp expression within T and B cells (CD3 and B220, respectively) but not myeloid cells allows for a competitive advantage over time in lethally irradiated WASp–/– recipients (129SvEv strain) transplanted with a 1:3 mixture of WT to WASp–/– BM cells. Peripheral blood from 5 mice was serially analyzed by flow cytometry at the indicated times after transplant to determine the percentage of WASp+ T, B, or myeloid cells. (D) The selective advantage of WASp-expressing cells within the T cell compartment is most marked in the peripheral Treg subset. WASp–/– mice (129SvEv strain) were transplanted as in C, and WASp expression among the indicated T cell populations was evaluated 12 months after transplant. WASp+ myeloid cells remain at the same percentage as when originally transplanted (approximately 25%), indicating no selective advantage. Recipients of WT:WASp–/– mixed BM transplants did not develop fatal, radiation-induced colitis, which occurred in all recipients of WASp–/– BM (data not shown). DP, CD4+CD8+ thymocytes; PLN Tregs, peripheral lymph node Tregs.
Figure 3
Figure 3. WASp–/– Tregs fail to control autoimmunity in sf mice.
Male Ly5.1 sf neonates (>3 days of age) were injected i.p. with 1 × 10⁶ to 2 × 10⁶ CD4+CD25+-enriched WT or WASp–/– Tregs (both Ly5.2), sacrificed at 30–45 days after cell transfer, and evaluated for levels of T cell activation and tissue inflammation. (A) WT Tregs but not WASp–/– Tregs prevent development of activated sf lymphocytes. Lymphocytes isolated from the spleen and lung parenchyma of recipient mice were stained for CD4, Ly5.1, CD44, and CD45RB. The relative percentage of activated CD44hiCD45RBlow T cells in each tissue is shown. All plots are gated on CD4+Ly5.1+ cells to identify recipient-derived cells, and donor cell source is indicated above each panel. Controls included age-matched, unmanipulated sf and WT animals. (B) Graph represents the percentage of CD44hiCD45RBlow-activated, recipient-derived cells (CD4+Ly5.1+) among all recipient animals. Each point represents data from 1 sf recipient of either WASp–/– (n = 5) or WT (n = 2) Tregs. (C) WT Tregs but not WASp–/– Tregs rescue sf mutant mice from development of autoimmune infiltration of major organs. Formalin-fixed liver and lung tissue from sf mice that received WT versus WASp–/– Tregs were paraffin embedded, sectioned, and stained with H&E to visualize tissue structure and inflammatory cell infiltration. Liver and lung sections from unmanipulated sf and WT mice are shown for comparison. Original magnification, ×10.
Figure 4
Figure 4. WASp is not required for generation of Tregs within the thymus.
(A) WASp is not required for the production of peripheral Tregs. Peripheral LN cells from WT or WASp–/– animals were stained simultaneously for CD4, CD25, and Foxp3 and evaluated by flow cytometry. Note that Foxp3+ Tregs are present in WASp–/– mice albeit at a slightly decreased percentage. (B) WASp–/– and WT mice have a similar percentage of Tregs (CD4+ CD25+Foxp3+) within the CD4+ SP thymic population. Both 6- and 16-week-old WT and WASp–/– C57BL/6 mice (n = 5 for each age and strain) were evaluated. (C) The selective advantage of WASp+ T cells is not manifest in the thymus. The percentage of WASp+ cells was evaluated within various thymic cell subsets in 6- to 8-week-old WASp+/– heterozygous female carriers (C57BL/6 strain) (n = 5). Error bars show SD. Relative WASp expression was not significantly different among any subset evaluated. DN, CD4CD8 thymocytes. Representative data from 1 of at least 3 experiments are shown.
Figure 5
Figure 5. WASp–/– Tregs exhibit in vitro suppressive activity.
CD4+CD25 effector T cells (TEFF) and CD4+CD25+ cells (Tregs) were isolated from WT or WASp–/– mice (C57BL/6 strain). WT or WASp–/– TEFF were labeled with CSFE and plated as targets with WT or WASp–/– Tregs at the Treg/TEFF (target) ratios noted in the presence of irradiated APCs. Cultures were stimulated with 3 μg/ml anti-CD3 and 1 μg/ml anti-CD28 for 110 hours. Relative CFSE dilution was measured in cultures containing WT (A) or WASp–/– (B) targets. Unstimulated and control-stimulated (CD3/CD28 without Tregs) cells are shown in the left panels.
Figure 6
Figure 6. WASp–/– Tregs demonstrate a competitive disadvantage in vivo.
(A) Heterozygous female carriers (6 months) demonstrate marked skewing within the Treg population. Naive T cells from peripheral blood (CD3+CD62L+CD44) and Tregs from peripheral LNs (CD4+CD25+CD69) were analyzed for relative WASp expression by flow cytometry. Mean ± SD is shown with the results of the paired 2-tailed Student’s t test. Identical results were obtained using CD4+Foxp3+ staining to identify Tregs. PEC, peritoneal cavity exudate; MLN, mesenteric lymph node. (B) WASp confers selective advantage during peripheral maturation/expansion of Tregs. The Treg population in different tissues from 6- to 8-week-old WASp+/– heterozygous mice (C57BL/6 strain) was evaluated for WASp expression by flow cytometry gated on the CD4+Foxp3+ population. Paired 2-tailed Student’s t test results indicate significant differences between peripheral lymphoid and thymic Tregs. (C) WASp–/– mice have lower Treg numbers than WT mice. CD4+Foxp3+ Tregs were evaluated in different tissues in WT versus WASp–/– C57BL/6 mice (ages 6 weeks to 6 months) and displayed as relative percentage of Tregs within the live cell gate. Pooled data were compared using the Mann-Whitney U test.
Figure 7
Figure 7. Purified WASp–/– Tregs fail to expand and compete effectively in vivo.
Male sf neonates (>4–5 days of age) heterozygous for Ly5.1 and Ly5.2 were injected i.p. with a 50:50 mixture of WT (Ly5.1) and WASp–/– (Ly5.2) CD4+CD25+ Tregs. Peripheral blood lymphocyte samples were analyzed at biweekly intervals starting at 14 days of age to measure the relative levels of donor Tregs. (A) Representative temporal analysis of the relative numbers of WT versus WASp–/– Tregs. FACS analysis of input (left panel) CD4+CD25+-enriched WT/WASp–/– Treg mixture stained for Ly5.1 and Ly5.2 (middle and right panels). Analysis of the relative level for each donor population within the CD4+Foxp3+ gate at time points indicated. Peripheral blood lymphocyte samples were costained for CD4, Foxp3, Ly5.1, and Ly5.2. (B) Graphic depiction of the relative percentage of WASp–/– Tregs remaining at each time point in 3 animals, based upon phenotypic analysis as described in A.
Figure 8
Figure 8. WASp–/– Tregs demonstrate decreased homing receptor expression relative to WT Tregs.
Female WASp+/– heterozygous mice (C57BL/6 strain) were analyzed for expression of CCR4, CCR6, CCR7, P selectin and E selectin ligands, and CD103 in WASp+ versus WASp Tregs in different tissues (spleen, peripheral LNs, mesenteric LNs, peritoneal fluid). (A) Total lymphocytes were stained with CD4, Foxp3, and WASp to identify Tregs (CD4+Foxp3+, upper gate) or CD4 TEFF (CD4+Foxp3, lower gate) cells. (B) Histogram of relative WASp expression in Tregs. (C) Histogram of WASp expression in the CD4 TEFF compartment. (D) Example of the relative percentage of splenic WASp versus WASp+ Tregs that coexpress CD103. (E) Mean ± SD for relative percentage of splenic Tregs coexpressing specific adhesion/homing receptors and WASp (with P values based upon paired 2-tailed Student’s t test). Similar data were obtained from other tissues. P sel. L, P selectin ligand; E sel. L, E selectin ligand.

References

    1. Sullivan K.E., Mullen C.A., Blaese R.M., Winkelstein J.A. A multiinstitutional survey of the Wiskott-Aldrich syndrome. J. Pediatr. 1994;125:876–885. - PubMed
    1. Thrasher A.J. WASp in immune-system organization and function. Nat. Rev. Immunol. . 2002;2:635–646. - PubMed
    1. Imai K., et al. Clinical course of patients with WASP gene mutations. Blood. 2004;103:456–464. - PubMed
    1. Dupuis-Girod S., et al. Autoimmunity in Wiskott-Aldrich syndrome: risk factors, clinical features, and outcome in a single-center cohort of 55 patients. Pediatrics. 2003;111:e622–e627. - PubMed
    1. Burns S., Cory G.O., Vainchenker W., Thrasher A.J. Mechanisms of WASp-mediated hematologic and immunologic disease. Blood. 2004;104:3454–3462. - PubMed

Publication types

MeSH terms