

Repression of flowering in Arabidopsis requires activation of FLOWERING LOCUS C expression by the histone variant H2A.Z
- PMID: 17220196
- PMCID: PMC1820970
- DOI: 10.1105/tpc.106.048447
Repression of flowering in Arabidopsis requires activation of FLOWERING LOCUS C expression by the histone variant H2A.Z
Abstract
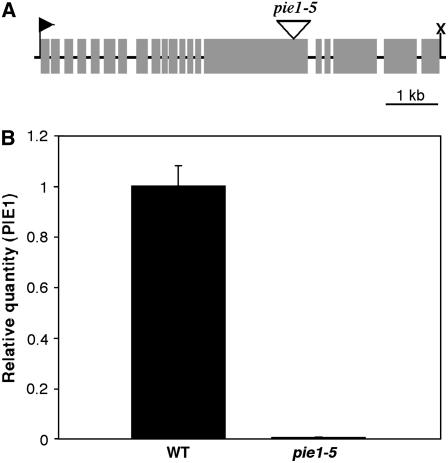
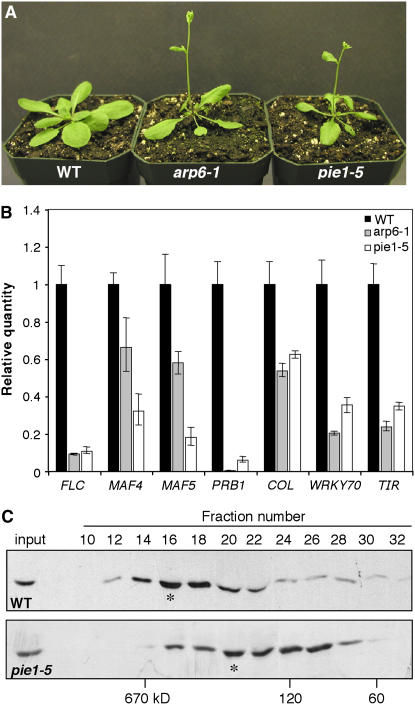
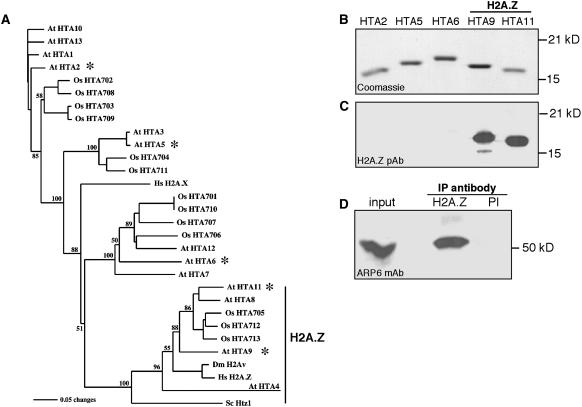
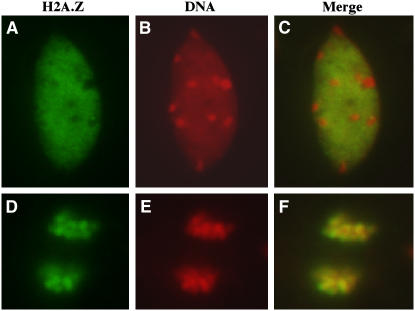
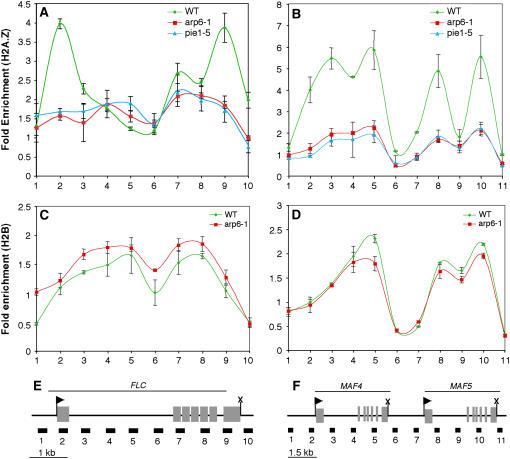
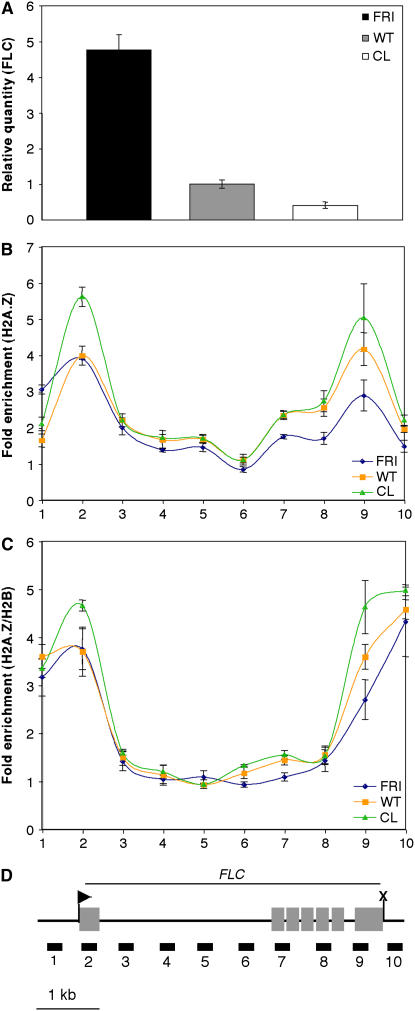
The histone variant H2A.Z has been implicated in numerous chromatin-mediated processes, including transcriptional activation, euchromatin maintenance, and heterochromatin formation. In yeast and humans, H2A.Z is deposited into chromatin by a conserved protein complex known as SWR1 and SRCAP, respectively. Here, we show that mutations in the Arabidopsis thaliana homologs of two components of this complex, ACTIN-RELATED PROTEIN6 (ARP6) and PHOTOPERIOD-INDEPENDENT EARLY FLOWERING1 (PIE1), produce similar developmental phenotypes and result in the misregulation of a common set of genes. Using H2A.Z-specific antibodies, we demonstrate that ARP6 and PIE1 are required for the deposition of H2A.Z at multiple loci, including the FLOWERING LOCUS C (FLC) gene, a central repressor of the transition to flowering. Loss of H2A.Z from chromatin in arp6 and pie1 mutants results in reduced FLC expression and premature flowering, indicating that this histone variant is required for high-level expression of FLC. In addition to defining a novel mechanism for the regulation of FLC expression, these results support the existence of a SWR1-like complex in Arabidopsis and show that H2A.Z can potentiate transcriptional activation in plants. The finding that H2A.Z remains associated with chromatin throughout mitosis suggests that it may serve an epigenetic memory function by marking active genes and poising silenced genes for reactivation.
Figures
Similar articles
-
SEF, a new protein required for flowering repression in Arabidopsis, interacts with PIE1 and ARP6.Plant Physiol. 2007 Feb;143(2):893-901. doi: 10.1104/pp.106.092270. Epub 2006 Dec 1. Plant Physiol. 2007. PMID: 17142478 Free PMC article.
-
The nuclear actin-related protein ARP6 is a pleiotropic developmental regulator required for the maintenance of FLOWERING LOCUS C expression and repression of flowering in Arabidopsis.Plant Cell. 2005 Oct;17(10):2633-46. doi: 10.1105/tpc.105.035196. Epub 2005 Sep 2. Plant Cell. 2005. PMID: 16141450 Free PMC article.
-
Arabidopsis homologs of components of the SWR1 complex regulate flowering and plant development.Development. 2007 May;134(10):1931-41. doi: 10.1242/dev.001891. Development. 2007. PMID: 17470967
-
Chromatin regulation of flowering.Trends Plant Sci. 2012 Sep;17(9):556-62. doi: 10.1016/j.tplants.2012.05.001. Epub 2012 Jun 2. Trends Plant Sci. 2012. PMID: 22658650 Review.
-
Role of chromatin modification in flowering-time control.Trends Plant Sci. 2005 Jan;10(1):30-5. doi: 10.1016/j.tplants.2004.11.003. Trends Plant Sci. 2005. PMID: 15642521 Review.
Cited by
-
Low-Phosphate Chromatin Dynamics Predict a Cell Wall Remodeling Network in Rice Shoots.Plant Physiol. 2020 Mar;182(3):1494-1509. doi: 10.1104/pp.19.01153. Epub 2019 Dec 19. Plant Physiol. 2020. PMID: 31857425 Free PMC article.
-
Histone H2A.Z regulates the expression of several classes of phosphate starvation response genes but not as a transcriptional activator.Plant Physiol. 2010 Jan;152(1):217-25. doi: 10.1104/pp.109.145532. Epub 2009 Nov 6. Plant Physiol. 2010. PMID: 19897606 Free PMC article.
-
Contribution of the histone variant H2A.Z to expression of responsive genes in plants.Semin Cell Dev Biol. 2023 Feb 15;135:85-92. doi: 10.1016/j.semcdb.2022.04.006. Epub 2022 Apr 23. Semin Cell Dev Biol. 2023. PMID: 35474148 Free PMC article. Review.
-
Regulatory subunit B'gamma of protein phosphatase 2A prevents unnecessary defense reactions under low light in Arabidopsis.Plant Physiol. 2011 Jul;156(3):1464-80. doi: 10.1104/pp.111.178442. Epub 2011 May 12. Plant Physiol. 2011. PMID: 21571669 Free PMC article.
-
Rapid and reversible light-mediated chromatin modifications of Arabidopsis phytochrome A locus.Plant Cell. 2011 Feb;23(2):459-70. doi: 10.1105/tpc.110.080481. Epub 2011 Feb 11. Plant Cell. 2011. PMID: 21317377 Free PMC article.
References
-
- Abbott, D.W., Ivanova, V.S., Wang, X., Bonner, W.M., and Ausio, J. (2001). Characterization of the stability and folding of H2A.Z chromatin particles: Implications for transcriptional activation. J. Biol. Chem. 276 41945–41949. - PubMed
-
- Alen, C., Kent, N.A., Jones, H.S., O'Sullivan, J., Aranda, A., and Proudfoot, N.J. (2002). A role for chromatin remodeling in transcriptional termination by RNA polymerase II. Mol. Cell 10 1441–1452. - PubMed
Publication types
MeSH terms
Substances
Grants and funding
LinkOut - more resources
Full Text Sources
Other Literature Sources
Molecular Biology Databases
