

Coordinative organization of lingual propulsion during the normal adult swallow
- PMID: 17221289
- PMCID: PMC2866114
- DOI: 10.1007/s00455-006-9053-4
Coordinative organization of lingual propulsion during the normal adult swallow
Abstract
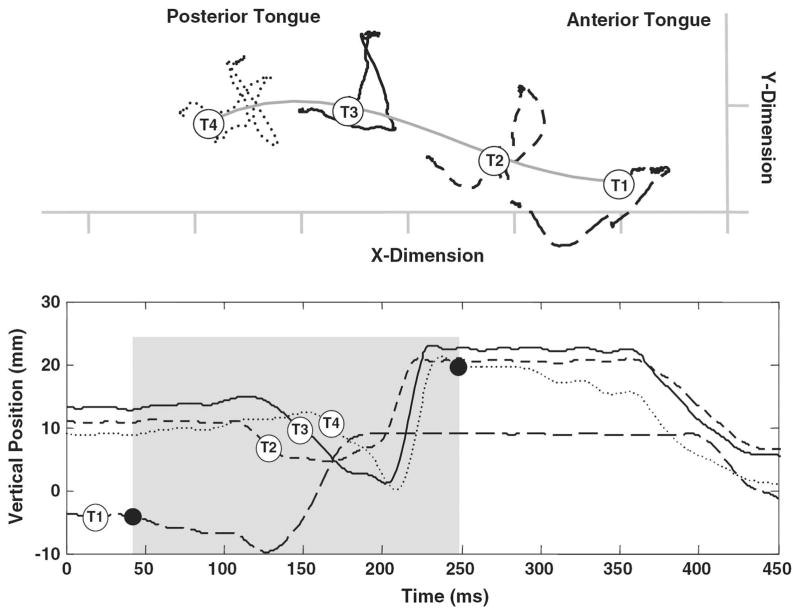
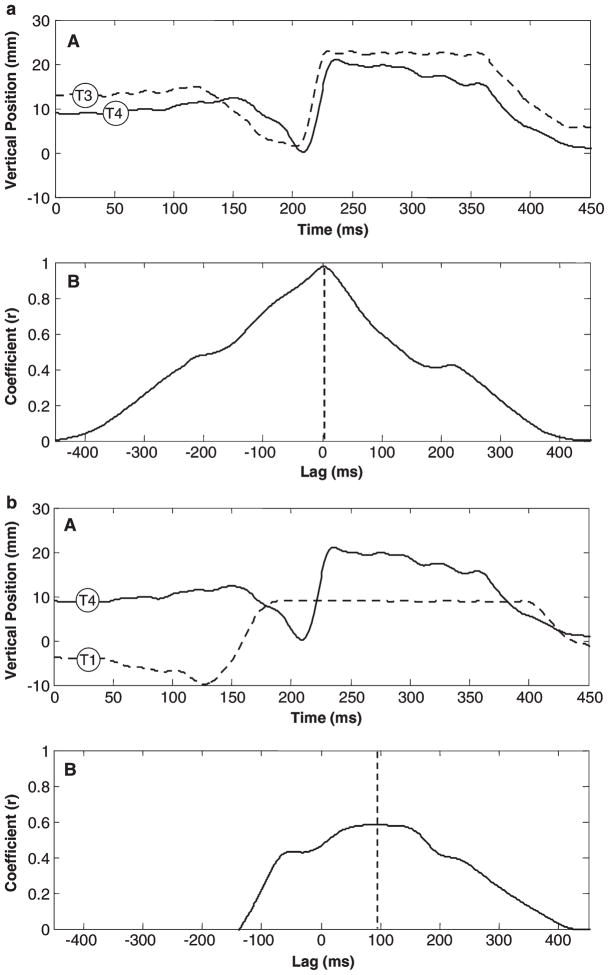
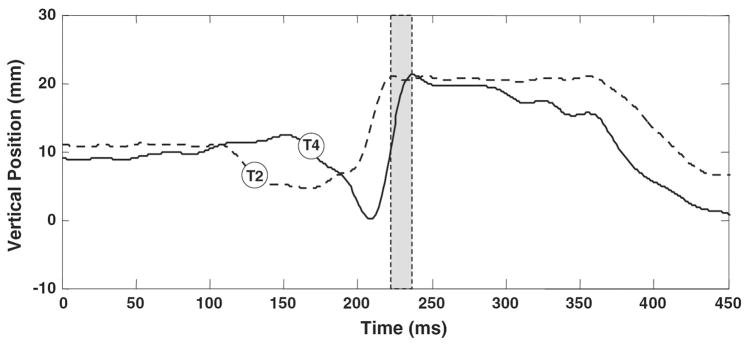
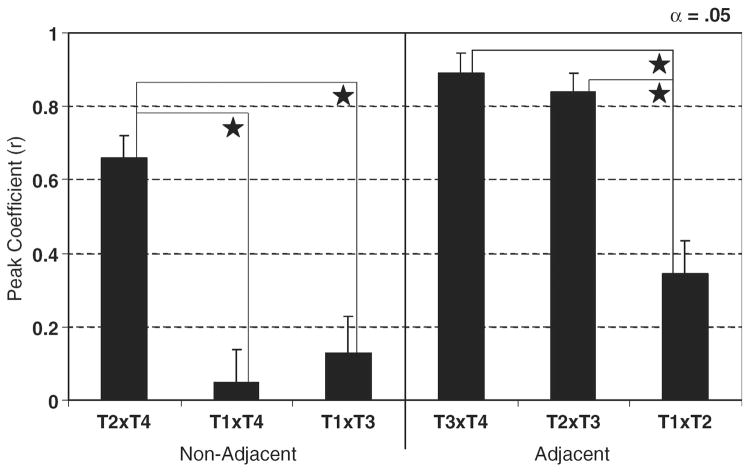
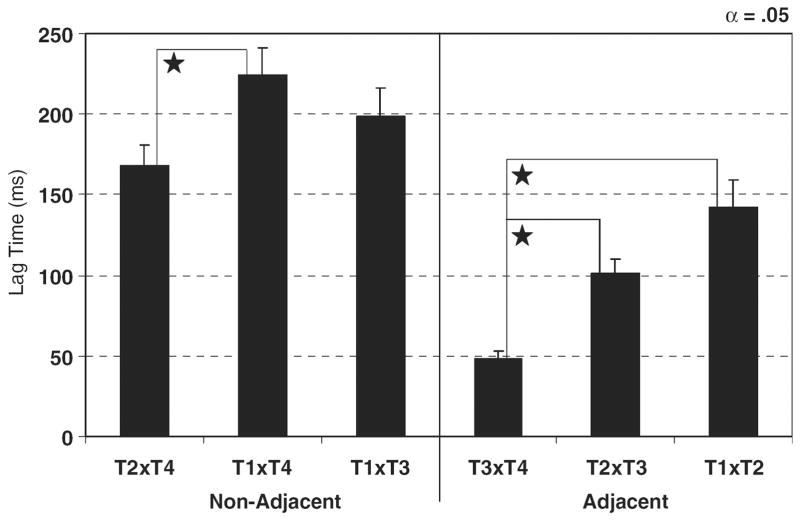
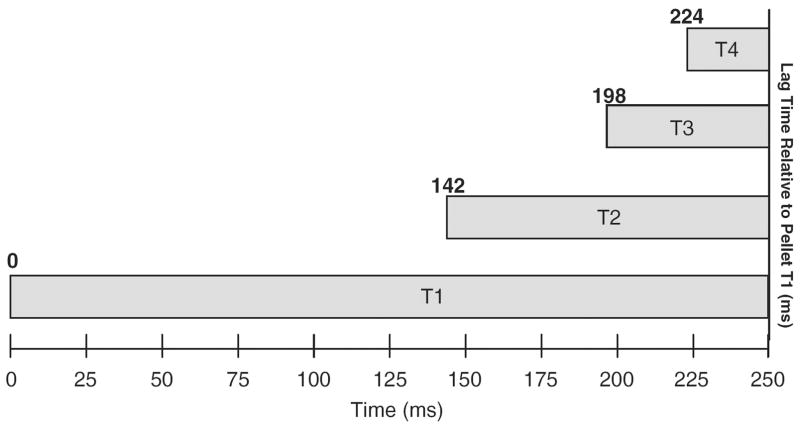
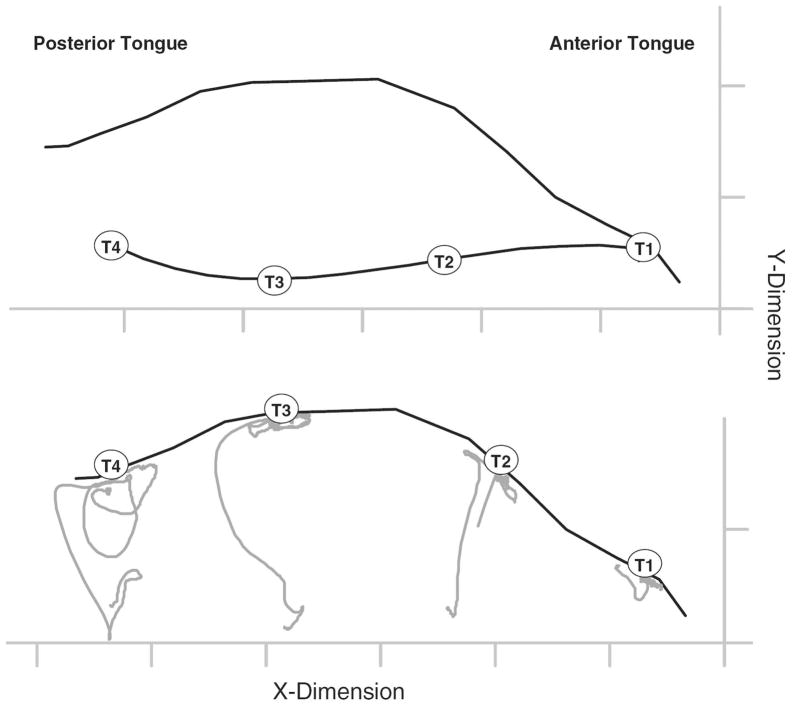
Lingual propulsion during swallowing is characterized by the sequential elevation of the anterior, middle, and dorsal regions of the tongue. Although lingual discoordination underlies many swallowing disorders, the coordinative organization of lingual propulsion during the typical and disordered swallow is poorly understood. The purpose of this investigation was to quantitatively describe the coordinative organization of lingual propulsion during the normal adult swallow. Tongue movement data were obtained from the X-Ray Microbeam Database at the University of Wisconsin. Movement of four pellets placed on specific tongue regions were tracked in 36 healthy adult participants while they swallowed 10 cc of water across five discrete trials. The propulsive action of the tongue during bolus transport was quantified using a cross-correlation analysis. Lingual transit time (LTT), which was defined as the interval (lag time) between the movements of the anterior- and posterior-most tongue regions, was determined to be approximately 168 ms. The average time interval (lag) between the movements of the posterior tongue regions was significantly shorter than the intervals between more anterior tongue regions. The results also suggest that during bolus transport movement patterns of the anterior tongue regions are distinct from those of the posterior tongue regions. Future work is needed to determine if the absence of the observed coordinative organization of lingual propulsion is indicative of oral stage dysphagia.
Figures
Similar articles
-
A Novel Three-Dimensional Analysis of Tongue Movement During Water and Saliva Deglutition: A Preliminary Study on Swallowing Patterns.Dysphagia. 2019 Jun;34(3):397-406. doi: 10.1007/s00455-018-9953-0. Epub 2018 Oct 31. Dysphagia. 2019. PMID: 30382383 Free PMC article.
-
Lingual action in normal sequential swallowing.J Speech Lang Hear Res. 1998 Aug;41(4):771-85. doi: 10.1044/jslhr.4104.771. J Speech Lang Hear Res. 1998. PMID: 9712125
-
Patterns of lingual tissue deformation associated with bolus containment and propulsion during deglutition as determined by echo-planar MRI.J Magn Reson Imaging. 1998 May-Jun;8(3):554-60. doi: 10.1002/jmri.1880080307. J Magn Reson Imaging. 1998. PMID: 9626868
-
The Effect of Lingual Resistance Training Interventions on Adult Swallow Function: A Systematic Review.Dysphagia. 2020 Oct;35(5):745-761. doi: 10.1007/s00455-019-10066-1. Epub 2019 Oct 14. Dysphagia. 2020. PMID: 31612288 Free PMC article.
-
Use of electromagnetic midsagittal articulography in the study of swallowing.J Speech Lang Hear Res. 2004 Apr;47(2):342-52. doi: 10.1044/1092-4388(2004/027). J Speech Lang Hear Res. 2004. PMID: 15157134 Review.
Cited by
-
How Passive Neck Immobilisation Influences Tongue Mobility and Strength: An Observational Study.J Oral Rehabil. 2025 May;52(5):604-615. doi: 10.1111/joor.13926. Epub 2025 Jan 2. J Oral Rehabil. 2025. PMID: 39748134 Free PMC article.
-
Effects of Age and Lingual-Palatal Pressure Levels on Submental Surface Electromyography Measures.Dysphagia. 2023 Oct;38(5):1277-1285. doi: 10.1007/s00455-023-10553-6. Epub 2023 Jan 19. Dysphagia. 2023. PMID: 36656382
-
Nasal versus oronasal raised volume forced expirations in infants--a real physiologic challenge.Pediatr Pulmonol. 2012 Aug;47(8):780-94. doi: 10.1002/ppul.22509. Epub 2012 Feb 10. Pediatr Pulmonol. 2012. PMID: 22328241 Free PMC article.
-
Task specificity in early oral motor development.Semin Speech Lang. 2008 Nov;29(4):257-66. doi: 10.1055/s-0028-1103389. Epub 2008 Dec 4. Semin Speech Lang. 2008. PMID: 19058112 Free PMC article. Review.
-
Surface electromyography pattern of human swallowing.BMC Oral Health. 2008 Mar 26;8:6. doi: 10.1186/1472-6831-8-6. BMC Oral Health. 2008. PMID: 18366770 Free PMC article.
References
-
- Cleall JF. Deglutition: A study of form and function. Am J Orthod. 1965;51:566–594. - PubMed
-
- Shawker TH, Sonies B, Hall TE, Baum BF. Ultrasound analysis of tongue, hyoid, and larynx activity during swallowing. Invest Radiol. 1984;19:82–86. - PubMed
-
- Stone M, Shawker TH. An ultrasound examination of tongue movement during swallowing. Dysphagia. 1986;1:78–83. - PubMed
-
- Shaker R, Cook IJS, Dodds WJ, Hogan WJ. Pressure-flow dynamics of the oral phase of swallowing. Dysphagia. 1988;3:79–84. - PubMed
-
- Martin RE. Unpublished doctoral dissertation. University of Wisconsin-Madison; 1991. A comparison of lingual movement in swallowing and speech production.
Publication types
MeSH terms
Grants and funding
LinkOut - more resources
Full Text Sources
