

Dendritic cells program non-immunogenic prostate-specific T cell responses beginning at early stages of prostate tumorigenesis
- PMID: 17221844
- PMCID: PMC2846359
- DOI: 10.1002/pros.20549
Dendritic cells program non-immunogenic prostate-specific T cell responses beginning at early stages of prostate tumorigenesis
Abstract
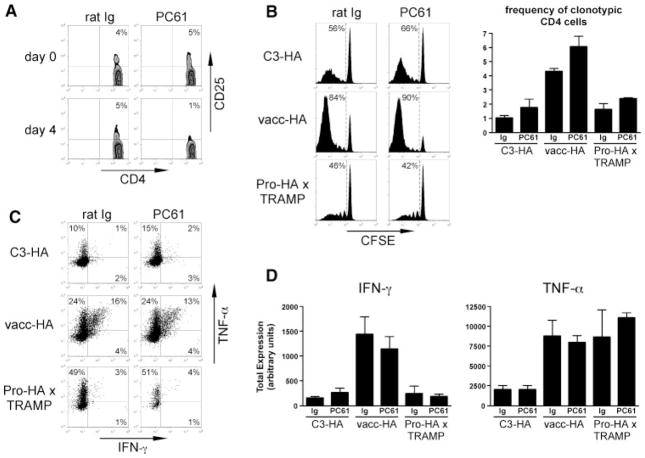
Background: Prostate cancer promotes the development of T cell tolerance towards prostatic antigens, potentially limiting the efficacy of prostate cancer vaccines targeting these antigens. Here, we sought to determine the stage of disease progression when T cell tolerance develops, as well as the role of steady state dendritic cells (DC) and CD4(+)CD25(+) T regulatory cells (Tregs) in programming tolerance.
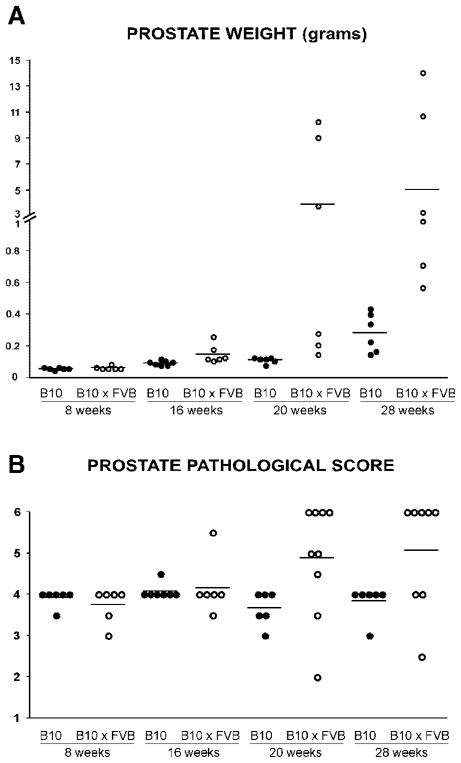
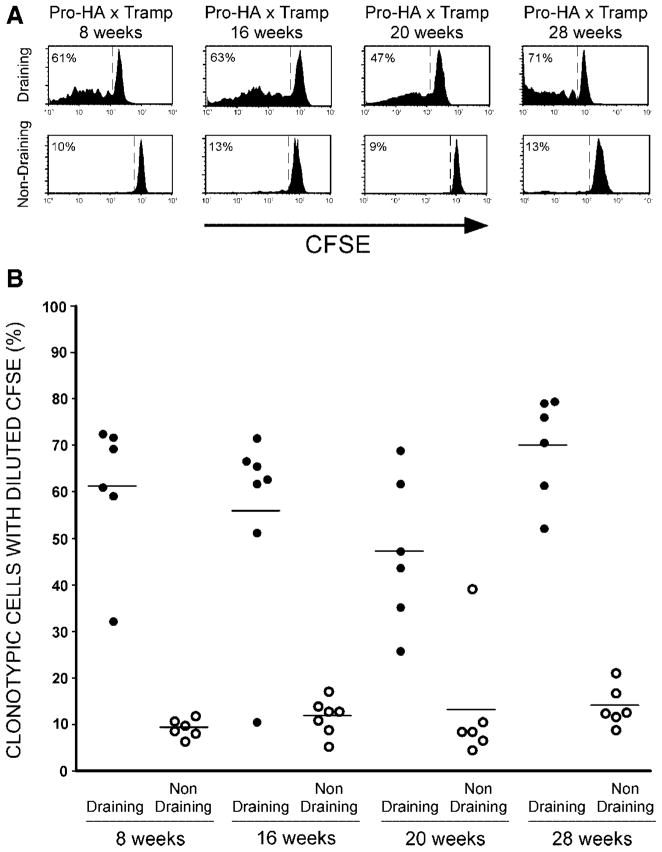
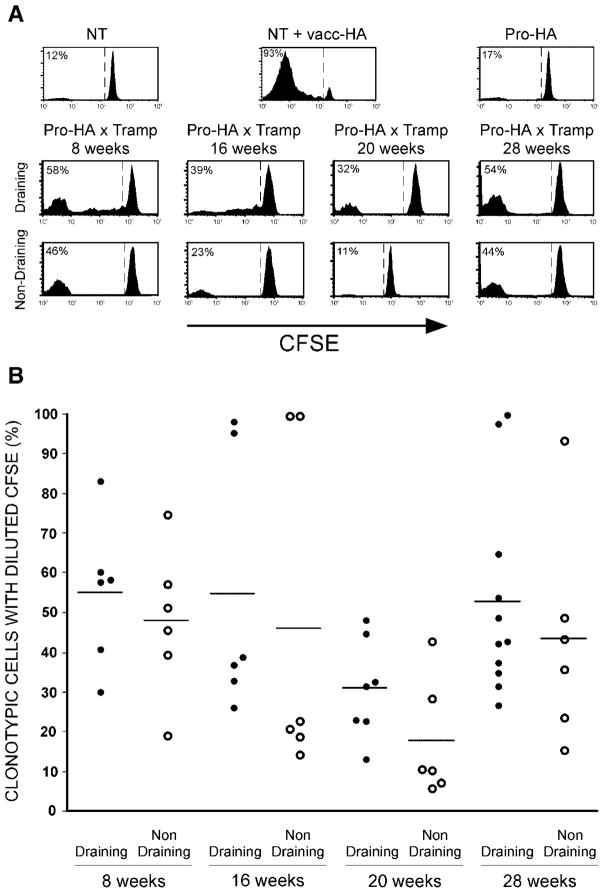
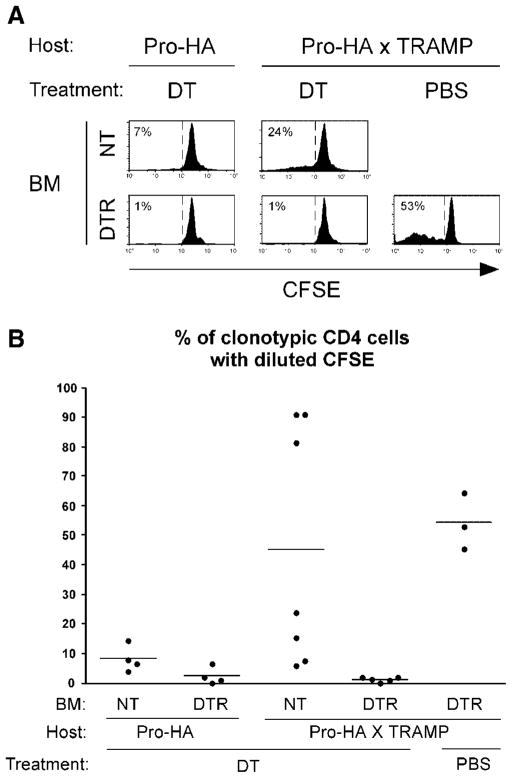
Methods: The response of naïve HA-specific CD4(+) T cells were analyzed following adoptive transfer into Pro-HA x TRAMP transgenic mice harboring variably-staged HA-expressing prostate tumors on two genetic backgrounds that display different patterns and kinetics of tumorigenesis. The role of DC and Tregs in programming HA-specific CD4 cell responses were assessed via depletion.
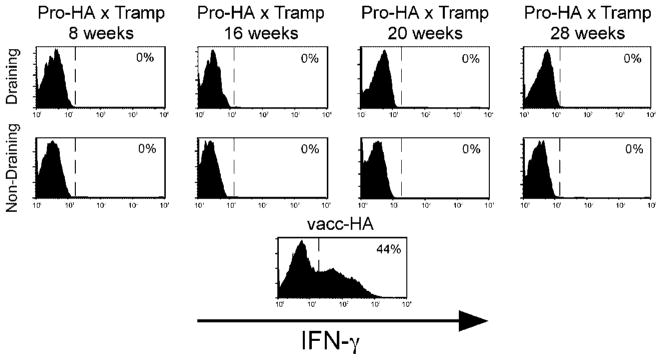
Results: HA-specific CD4 cells underwent non-immunogenic responses at all stages of tumorigenesis in both genetic backgrounds. These responses were completely dependent on DC, but not appreciably influenced by Tregs.
Conclusions: These results suggest that tolerogenicity is an early and general property of prostate tumors.
Figures
Similar articles
-
Peripheral T-cell tolerance associated with prostate cancer is independent from CD4+CD25+ regulatory T cells.Cancer Res. 2008 Jan 1;68(1):292-300. doi: 10.1158/0008-5472.CAN-07-2429. Cancer Res. 2008. PMID: 18172322
-
Breaking immune tolerance by targeting CD25+ regulatory T cells is essential for the anti-tumor effect of the CTLA-4 blockade in an HLA-DR transgenic mouse model of prostate cancer.Prostate. 2014 Oct;74(14):1423-32. doi: 10.1002/pros.22858. Epub 2014 Aug 11. Prostate. 2014. PMID: 25111463
-
CD4+CD25+ T regulatory cells induced by LPS-activated bone marrow dendritic cells suppress experimental autoimmune uveoretinitis in vivo.Graefes Arch Clin Exp Ophthalmol. 2007 Feb;245(2):221-9. doi: 10.1007/s00417-006-0356-9. Graefes Arch Clin Exp Ophthalmol. 2007. PMID: 16741709
-
Dendritic cells expand antigen-specific Foxp3+ CD25+ CD4+ regulatory T cells including suppressors of alloreactivity.Immunol Rev. 2006 Aug;212:314-29. doi: 10.1111/j.0105-2896.2006.00422.x. Immunol Rev. 2006. PMID: 16903923 Review.
-
Revisiting Current Concepts on the Tolerogenicity of Steady-State Dendritic Cell Subsets and Their Maturation Stages.J Immunol. 2021 Apr 15;206(8):1681-1689. doi: 10.4049/jimmunol.2001315. J Immunol. 2021. PMID: 33820829 Review.
Cited by
-
Betting on improved cancer immunotherapy by doubling down on CD134 and CD137 co-stimulation.Oncoimmunology. 2013 Jan 1;2(1):e22837. doi: 10.4161/onci.22837. Oncoimmunology. 2013. PMID: 23482891 Free PMC article.
-
CD134/CD137 dual costimulation-elicited IFN-γ maximizes effector T-cell function but limits Treg expansion.Immunol Cell Biol. 2013 Feb;91(2):173-83. doi: 10.1038/icb.2012.74. Epub 2013 Jan 8. Immunol Cell Biol. 2013. PMID: 23295363 Free PMC article.
-
Steady state dendritic cells present parenchymal self-antigen and contribute to, but are not essential for, tolerization of naive and Th1 effector CD4 cells.J Immunol. 2007 Aug 1;179(3):1524-31. doi: 10.4049/jimmunol.179.3.1524. J Immunol. 2007. PMID: 17641018 Free PMC article.
-
Increased pressure stimulates aberrant dendritic cell maturation.Cell Mol Biol Lett. 2008;13(2):260-70. doi: 10.2478/s11658-007-0054-6. Epub 2008 Apr 10. Cell Mol Biol Lett. 2008. PMID: 18161009 Free PMC article.
-
TCR gene therapy of spontaneous prostate carcinoma requires in vivo T cell activation.J Immunol. 2008 Aug 15;181(4):2563-71. doi: 10.4049/jimmunol.181.4.2563. J Immunol. 2008. PMID: 18684947 Free PMC article.
References
-
- Srivastava PK. Therapeutic cancer vaccines. Curr Opin Immunol. 2006;18(2):201–205. - PubMed
-
- Adler AJ. Mechanisms of T cell tolerance and suppression in cancer mediated by tumor-associated antigens and hormones. Curr Cancer Drug Targets. 2007;7(1):3–14. - PubMed
-
- Jemal A, Murray T, Ward E, Samuels A, Tiwari RC, Ghafoor A, Feuer EJ, Thun MJ. Cancer statistics, 2005. CA Cancer J Clin. 2005;55(1):10–30. - PubMed
-
- Hurwitz AA, Foster BA, Kwon ED, Truong T, Choi EM, Greenberg NM, Burg MB, Allison JP. Combination immunotherapy of primary prostate cancer in a transgenic mouse model using CTLA-4 blockade. Cancer Res. 2000;60(9):2444–2448. - PubMed
Publication types
MeSH terms
Substances
Grants and funding
LinkOut - more resources
Full Text Sources
Medical
Research Materials
