. 2007 Jan 12;3(1):e5.
doi: 10.1371/journal.pcbi.0030005. Epub 2006 Nov 30.

Protein and DNA sequence determinants of thermophilic adaptation

Affiliations

Protein and DNA sequence determinants of thermophilic adaptation

Konstantin B Zeldovich et al. PLoS Comput Biol. .

Abstract

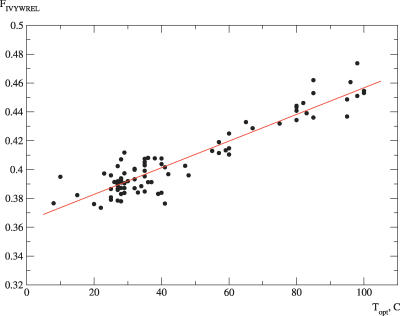
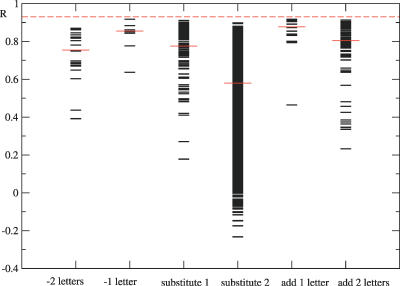
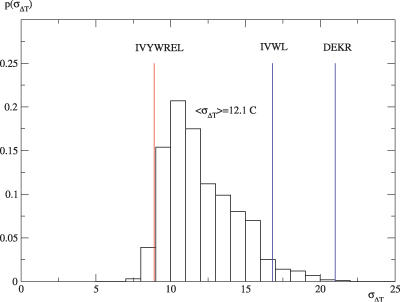
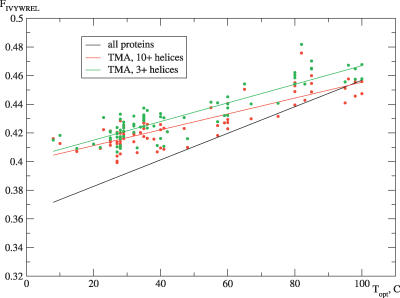
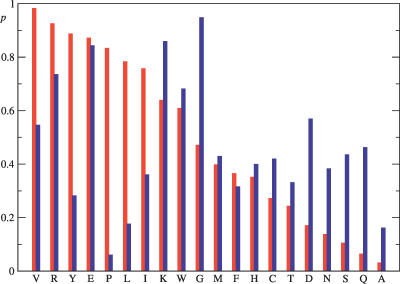
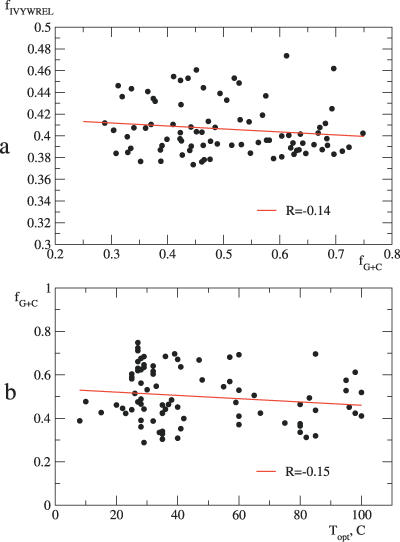
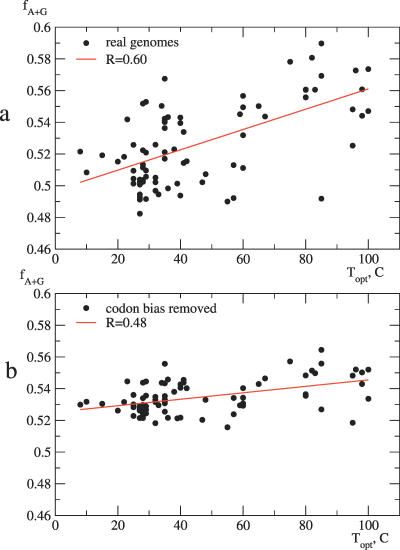
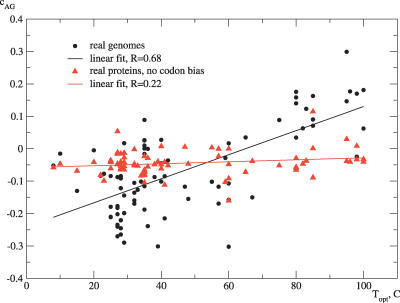
There have been considerable attempts in the past to relate phenotypic trait--habitat temperature of organisms--to their genotypes, most importantly compositions of their genomes and proteomes. However, despite accumulation of anecdotal evidence, an exact and conclusive relationship between the former and the latter has been elusive. We present an exhaustive study of the relationship between amino acid composition of proteomes, nucleotide composition of DNA, and optimal growth temperature (OGT) of prokaryotes. Based on 204 complete proteomes of archaea and bacteria spanning the temperature range from -10 degrees C to 110 degrees C, we performed an exhaustive enumeration of all possible sets of amino acids and found a set of amino acids whose total fraction in a proteome is correlated, to a remarkable extent, with the OGT. The universal set is Ile, Val, Tyr, Trp, Arg, Glu, Leu (IVYWREL), and the correlation coefficient is as high as 0.93. We also found that the G + C content in 204 complete genomes does not exhibit a significant correlation with OGT (R = -0.10). On the other hand, the fraction of A + G in coding DNA is correlated with temperature, to a considerable extent, due to codon patterns of IVYWREL amino acids. Further, we found strong and independent correlation between OGT and the frequency with which pairs of A and G nucleotides appear as nearest neighbors in genome sequences. This adaptation is achieved via codon bias. These findings present a direct link between principles of proteins structure and stability and evolutionary mechanisms of thermophylic adaptation. On the nucleotide level, the analysis provides an example of how nature utilizes codon bias for evolutionary adaptation to extreme conditions. Together these results provide a complete picture of how compositions of proteomes and genomes in prokaryotes adjust to the extreme conditions of the environment.


Conflict of interest statement

Competing interests. The authors have declared that no competing interests exist.

Figures

Figure 1
Figure 1. Correlation between the Sum F of Fractions of Ile, Val, Tyr, Trp, Arg, Glu, and Leu (IVYWREL) Amino Acids in 86 Proteomes and the OGT of Organisms T opt
The linear regression (red line) corresponds to the correlation coefficient R = 0.93. The OGT Topt (in degrees Celsius) can be calculated from the total fraction F of IVYWREL in the proteome according to Topt = 937F-335. By construction, the IVYWREL set is the most precise predictor of OGT among all possible combinations of amino acids; other combinations statistically yield a larger error of prediction of OGT.
Figure 2
Figure 2. Distribution of the Correlation Coefficient R between OGT and Fractions of Amino Acids in a Proteome for Different Variation of the IVYWREL Set, Additions or Deletions of One or Two Amino Acids to/from the Set, or Substitution of One or Two Amino Acids from the Set by One or Two Amino Acids Not from the Set
The dashed red line at R = 0.93 corresponds to the unperturbed IVYWREL. The horizontal red lines indicate the median values of the correlation coefficient for the given type of change of the predictor set.
Figure 3
Figure 3. The Distribution of the Root-Mean-Square Error σΔT of the Prediction of the OGT in the 1,000 43-Species Test Sets (Black), and the Prediction Errors for 86 Organisms Using the IVYWREL Set (Red) or Sets of Charged or Hydrophobic Residues (Blue)
Individually, sets of hydrophobic or charged residues provide a much lower precision than their proper combination, IVYWREL.
Figure 4
Figure 4. Total Fraction of IVYWREL Amino Acids in Alpha-Helical Membrane Proteins Containing Three or More (Green) or Ten or More (Red) Helices, Plotted against the OGT
Solid lines are linear regressions. The black line is the linear regression of the fraction of IVYWREL amino acids in all proteins in a proteome, the same as in Figure 1. The fraction of IVYWREL in membrane proteins of thermophilic organisms is about the same as in all of their proteins. In mesophiles, membrane proteins are enriched with hydrophobic residues. For membrane proteins with ten or more helices, the five best predictors are ILVWYGERKP, FILVWYATSERKP, FILVWYATSEHRKP, IVYWREL, MFILVWYATSEHRKP, 0.85 < R < 0.86.
Figure 5
Figure 5. Histogram of the Probability to Find an Amino Acid among 1,000 Combinations of Amino Acids Which Are Most Correlated with OGT for Real Proteomes (Red) and for Artificial Proteomes Created from Reshuffled DNA Sequences (Blue)
The histogram for real proteomes supports the stability of IVYWREL predictor, while the difference between the two histograms suggests that amino acid biases upon thermophilic adaptation are not a consequence of the trends in nucleotide composition.
Figure 6
Figure 6. G + C Content of Coding DNA Is Not Correlated with OGT or IVYWREL
(A) Dependence of the fraction of IVYWREL amino acids in 83 proteomes (protein thermostability predictor) on the fraction of G + C in the coding DNA in the corresponding genomes. (B) Dependence of the G + C content in the coding DNA of the 83 complete genomes on the OGT of the organisms. The correlation coefficient is R = −0.15, indicating that G + C content of the coding DNA is not related to the OGT.
Figure 7
Figure 7. Effect of Codon Bias on the Increase of Purine Load with OGT
(A) The fraction of A + G in the coding DNA of the 83 complete genomes is highly correlated with the OGT, R = 0.60. (B) When protein sequences of the 83 organisms are reverse-translated into DNA without codon bias, the fraction of A + G remains correlated with OGT, R = 0.48.
Figure 8
Figure 8. Dependence of the Pairwise Nearest-Neighbor Correlation Function for A,G Nucleotides cAG on the OGT in the Genomes of 83 Species (Black) and in the DNA Sequences Obtained from the Proteomes of 83 Species without Codon Bias (Red)
While codon bias is not essential for reproducing the trends in nucleotide composition (Figure 6), nucleotide correlations are entirely dependent on the proper choice of codon bias. An increase of the number of ApG dinucleotides enhances the stacking interactions in DNA, stabilizing it at elevated environmental temperatures.

References

    1. Shakhnovich EI. Proteins with selected sequences fold into unique native conformation. Phys Rev Lett. 1994;72:3907–3910. - PubMed
    1. Jaenicke R, Bohm G. Stability of proteins in extreme environments. Curr Opin Struct Biol. 1998;8:738–748. - PubMed
    1. Jaenicke R. Stability and stabilization of globular proteins in solution. J Biotechnol. 2000;79:193–203. - PubMed
    1. Berezovsky IN, Shakhnovich EI. Physics and evolution of thermophilic adaptation. Proc Natl Acad Sci U S A. 2005;102:12742–12747. - PMC - PubMed
    1. Thompson MJ, Eisenberg D. Transproteomic evidence of a loop-deletion mechanism for enhancing protein thermostability. J Mol Biol. 1999;290:595–604. - PubMed

Publication types