. 2007 Jan 12;3(1):e10.
doi: 10.1371/journal.pgen.0030010. Epub 2006 Dec 6.

Repeated recruitment of LTR retrotransposons as promoters by the anti-apoptotic locus NAIP during mammalian evolution

Affiliations

Repeated recruitment of LTR retrotransposons as promoters by the anti-apoptotic locus NAIP during mammalian evolution

Mark T Romanish et al. PLoS Genet. .

Abstract

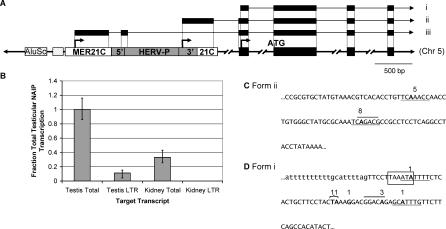
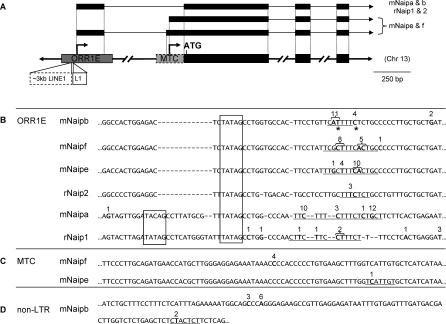
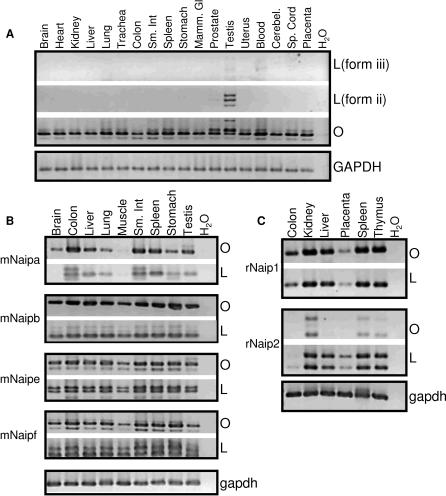
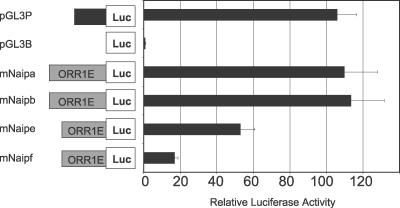
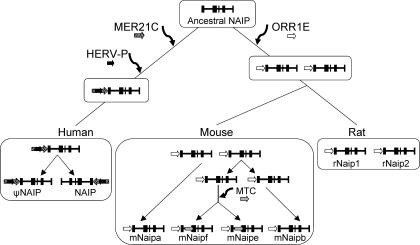
Neuronal apoptosis inhibitory protein (NAIP, also known as BIRC1) is a member of the conserved inhibitor of apoptosis protein (IAP) family. Lineage-specific rearrangements and expansions of this locus have yielded different copy numbers among primates and rodents, with human retaining a single functional copy and mouse possessing several copies, depending on the strain. Roles for this gene in disease have been documented, but little is known about transcriptional regulation of NAIP. We show here that NAIP has multiple promoters sharing no similarity between human and rodents. Moreover, we demonstrate that multiple, domesticated long terminal repeats (LTRs) of endogenous retroviral elements provide NAIP promoter function in human, mouse, and rat. In human, an LTR serves as a tissue-specific promoter, active primarily in testis. However, in rodents, our evidence indicates that an ancestral LTR common to all rodent genes is the major, constitutive promoter for these genes, and that a second LTR found in two of the mouse genes is a minor promoter. Thus, independently acquired LTRs have assumed regulatory roles for orthologous genes, a remarkable evolutionary scenario. We also demonstrate that 5' flanking regions of IAP family genes as a group, in both human and mouse are enriched for LTR insertions compared to average genes. We propose several potential explanations for these findings, including a hypothesis that recruitment of LTRs near NAIP or other IAP genes may represent a host-cell adaptation to modulate apoptotic responses.


Conflict of interest statement

Competing interests. The authors have declared that no competing interests exist.

Figures

Figure 1
Figure 1. Contribution of LTR Promoters to Human NAIP Transcription and a Summary of 5′ RACE Results
(A) Representation of a 5′ region of human NAIP gene. Transcription initiates at arrows situated above the underlying genomic DNA, with representative RNAs pictured above. Black boxes represent exons in DNA and RNA forms. White boxes represent a solitary MER21C LTR into which a HERV-P element has inserted (gray box). Sections of the HERV-P labeled 5′ and 3′ represent the 5′ and 3′ LTRs of this partly deleted ERV. Both the MER21C and the HERV-P are oriented in the same transcriptional direction as the NAIP gene. The boxes to the left of the MER21C denote an AluSc SINE and an MIR SINE (unlabeled). Three TSSs for human NAIP have been reported or were identified here: isoform i is found in all tissues tested, while ii represents the testis-specific HERV-P start site, and iii represents the published TSS determined in the THP1 leukemic cell line [21]. (B) Quantitative real-time RT-PCR analysis of human testis and kidney cDNA to determine contribution of the HERV-P LTR promoter to total NAIP transcription. Total transcript levels were determined using primers that amplify all of the most prevalent transcript forms, and LTR-driven transcripts were determined using one primer in the LTR (see Figure S1A for locations of primers and Materials and Methods for details). Expression levels are normalized to GAPDH and represented relative to total NAIP transcript levels in testis. Assays were carried out in duplicate and repeated three times in testis and two times in kidney. (C) Partial sequence of the HERV-P element (5′ end corresponds to Chromosome 5: 70,355,179 of the human March 2006 genomic assembly) underlying testis-specific TSSs of NAIP. The numbers of sequenced 5′ RACE clones aligning to particular TSSs are shown above the sequence. The putative TATA box identified previously in HERV-P LTRs [26] is at the end of the sequence shown. (D) Underlying sequence and TSSs determined for the non-LTR promoter (Chromosome 5: 70,352,387) in blood, liver, placenta, and testis. Lowercase letters distinguish intron/exon boundary. Two 5′ RACE clones aligned upstream of the intronic sequence shown. Numbers above boldfaced nucleotides indicate sites of transcription and the number of 5′ RACE clones that align to each TSS. Underlines and overlines indicate putative initiator elements and downstream promoter elements, respectively [25]. Boxed sequence represents a putative TATA box. Full characterization of human UTRs can be found in Figure S1.
Figure 2
Figure 2. Contribution of LTR Promoters to Mouse and Rat Naip Transcription and a Summary of 5′ RACE Results
(A) Representation of 5′ region of rodent Naip genes. Transcription initiates at arrows situated above the underlying genomic DNA, with representative RNAs pictured above. Gray shaded boxes represent the solitary LTR insertions, and black boxes represent exons in DNA and RNA forms. Mouse and rat Naip transcription predominately initiates in ORR1E LTRs. mNaipe and mNaipf have an MTC LTR (dashed gray box) and ∼3 kb of L1_Mus1 LINE1 sequence has integrated into the ORR1E LTRs associated with these two genes, shown by a dashed white box. The rNaip2 ORR1E LTR has also been interrupted by an independent insertion of 300 bp of Lx2A1 LINE1, shown by solid white box. (B) Partial alignment of the rodent ORR1E LTRs associated with Naip transcription. The 5′ end of the sequences shown corresponds to the following coordinates in the mouse (mm8) and rat (rn4) draft sequences. (mNaipa = Chromosome 13: 101,553,198; mNaipb = Chromosome 13: 101,302,420; mNaipe = Chromosome 13: 101,347,641; mNaipf = Chromosome 13: 101,418,005; rNaip1 = Chromosome 2: 31,268,656; rNaip2 = Chromosome 2: 31,204,793). Numbers above boldfaced nucleotides indicate sites of transcription initiation and the number of 5′ RACE clones obtained that align to each TSS. A few mNaipe clones aligned beyond the boundaries of the ORR1E sequence shown. Underlines indicate putative initiator elements and boxed sequence represents putative TATA boxes. Asterisks denote sites of transcription that are supported by >1 CAGE tag [27]. (C) Partial alignment of the mNaipe/f MTC alternative promoters. (mNaipe = Chromosome 13: 101,346,591; mNaipf = Chromosome 13: 101,416,943). (D) Genomic sequence surrounding the mNaipb non-LTR promoter (mNaipb = Chromosome 13: 101,289,682). Full characterization of mouse UTRs can be found in Figure S2.
Figure 3
Figure 3. Transcriptional Profile of Human (A), Mouse (B), and Rat (C) NAIP across the Indicated Primary Tissues
Primers selective for LTR-derived transcripts (L) or coding sequence (O) determined the breadth of LTR promoter use in all tissues in all organisms. In (A), L(form iii) primers were specific for the MER21C LTR-transcribed form and L(form ii) primers were specific for the HERV-P form. A GAPDH control is shown at the bottom of each panel.
Figure 4
Figure 4. Promoter Activity of the mNaip LTRs
The ORR1E LTRs for each copy were cloned into a modified pGL3B vector and tested for luciferase activity in the MS1 cell line. pGL3B and pGL3P, containing a SV40 promoter, were used as negative and positive controls, respectively. Luciferase activity was normalized relative to the cotransfected Renilla luciferase control and then to pGL3B to demonstrate fold activation. Each bar represents the mean of at least four independent transfections ± SEM.
Figure 5
Figure 5. Association of LTR Elements with NAIP through Mammalian Evolution
A single NAIP progenitor was present in the last common ancestor of primates and rodents. Following the primate/rodent split, NAIP was independently targeted by multiple lineage-specific LTRs. In human, NAIP is part of a large inverted duplication but the centromeric copy is a pseudogene. In rodents, this locus duplicated prior to mouse-rat divergence. In mouse, Naip has undergone further expansion, where the two youngest copies, mNaipe and f, acquired the MTC LTR.
Figure 6
Figure 6. Comparison of Genomic Sequence Surrounding the Rodent Naip ORR1E LTRs
3 kb of sequence centered around the ORR1Es was analyzed by dot plots; diagonal lines represent regions of homology between compared sequences. Light gray, dark gray, white, and black boxes represent LTR elements, SINEs, LINEs, and simple repeats, respectively.
Figure 7
Figure 7. Density of TE Sequence in 5′ Flanking Regions of IAP Genes Compared to Random Gene Sets
Coverage of LTRs, LINEs, and SINEs in human (A, C, and E) and mouse (B, D, and F) was assessed in a 12.5-kb window surrounding database-annotated TSSs, 10 kb upstream and 2.5 kb downstream of the eight human and eight mouse IAP genes. These values, shown by solid arrows, were compared to the coverage of each type of repeat for 1,000 sets of eight random human and eight random mouse genes. For the human IAP genes, while SINE enrichment approaches significance (95th percentile), LTRs are significantly enriched (97th percentile), and LINEs are not overrepresented (20th percentile) within the analyzed windows. For the mouse IAP genes, both LTRs (99th percentile) and SINEs (98th percentile) are significantly enriched around the IAP 5′ termini, while LINEs are not (18th percentile). Dashed arrows show retroelement coverage in the same window for IAP genes when the NAIP genes themselves are removed from the analysis.

References

    1. Lander ES, Linton LM, Birren B, Nusbaum C, Zody MC, et al. Initial sequencing and analysis of the human genome. Nature. 2001;409:860–921. - PubMed
    1. Waterston RH, Lindblad-Toh K, Birney E, Rogers J, Abril JF, et al. Initial sequencing and comparative analysis of the mouse genome. Nature. 2002;420:520–562. - PubMed
    1. Nekrutenko A, Li WH. Transposable elements are found in a large number of human protein-coding genes. Trends Genet. 2001;17:619–621. - PubMed
    1. Gotea V, Makalowski W. Do transposable elements really contribute to proteomes? Trends Genet. 2006;22:260–267. - PubMed
    1. Jordan IK, Rogozin IB, Glazko GV, Koonin EV. Origin of a substantial fraction of human regulatory sequences from transposable elements. Trends Genet. 2003;19:68–72. - PubMed

Publication types

Substances