. 2007 Jan 14:6:5.
doi: 10.1186/1476-4598-6-5.

High mobility group A2 is a target for miRNA-98 in head and neck squamous cell carcinoma

Affiliations

High mobility group A2 is a target for miRNA-98 in head and neck squamous cell carcinoma

Carla Hebert et al. Mol Cancer. .

Abstract

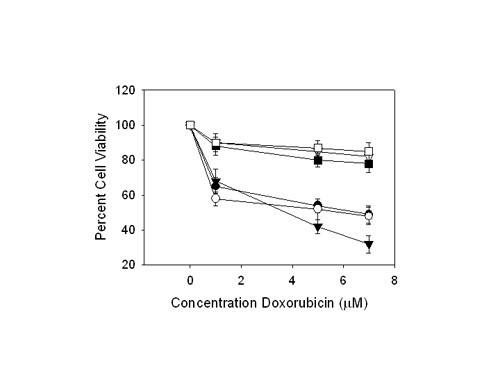
Background: HMGA2 expression has been shown to be associated with enhanced selective chemosensitivity towards the topoisomerase (topo) II inhibitor, doxorubicin, in cancer cells. Although the roles of signaling cascades and proteins as regulatory factors in development, neoplasia and adaptation to the environment are becoming well established, evidence for the involvement of regulatory small RNA molecules, such as microRNAs (miRNAs) as important regulators of both transcriptional and posttranscriptional gene silencing is presently mounting.

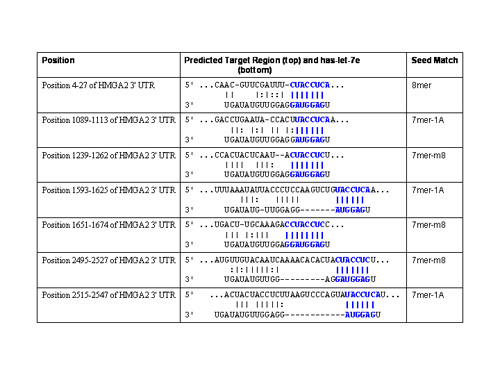
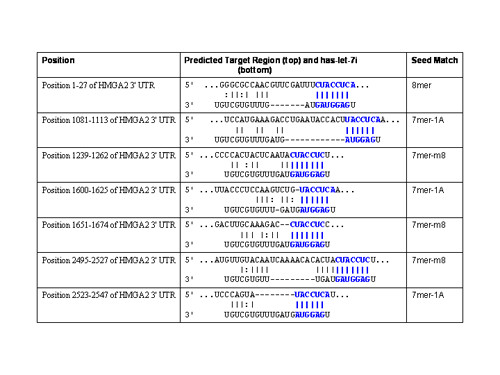
Results: Here we report that HMGA2 expression in head and neck squamous cell carcinoma (HNSCC) cells is regulated in part by miRNA-98 (miR-98). Albeit HMGA2 is associated with enhanced selective chemosensitivity towards topoisomerase (topo) II inhibitor, doxorubicin in HNSCC, the expression of HMGA2 is thwarted by hypoxia. This is accompanied by enhanced expression of miRNA-98 and other miRNAs, which predictably target HMGA2. Moreover, we show that transfection of pre-miR-98trade mark during normoxia diminishes HMGA2 and potentiates resistance to doxorubicin and cisplatin. These findings implicate the role of a miRNA as a key element in modulating tumors in variable microenvironments.

Conclusion: These studies validate the observation that HMGA2 plays a prominent role in governing genotoxic responses. However, this may only represent cells growing under normal oxygen tensions. The demonstration that miRNA profiles are altered during hypoxia and repress a genotoxic response indicates that changes in microenvironment in eukaryotes mimic those of lower species and plants, where, for example, abiotic stresses regulate the expression of thousands of genes in plants at both transcriptional and posttranscriptional levels through a number of miRNAs and other small regulatory RNAs.


Figures

Figure 1
Figure 1
Chemosensitivity towards doxorubicin of SCC cell lines. Percent cell viability following doxorubicin treatment to assess chemosensitivity towards doxorubicin was measured by MTT assays. SCC cell lines were grown under normoxic (▽ SCC-4, ■ SCC-10B and □ SCC-9) or hypoxic (● SCC-4, ○ SCC-10B, and ▼ SCC-9) conditions and treated with various concentrations of doxorubicin. Significant differences between cell lines grown under hypoxic conditions and normoxic conditions was detected for all three cell lines as determined by two-tailed Student's t test (p ≤ 0.05). The error bars represent the S.E.M. for 3 experiments.
Figure 2
Figure 2
Relative expression of miRNA-98 in normoxia and hypoxia. The relative levels of miRNA-98 were determined using the mirVana™ miRNA Isolation Kit and the miRVana qRT-PCR miRNA™ Detection kit for miR-98 and 5S (Ambion, Austin, TX). Cell lines were grown under normoxic or hypoxic (5% O2 and 1% O2) conditions. The differences between cell lines grown under normoxic condition were significantly different to those grown at 1% O2 with a P ≤ 0.05. The error bars represent S.E.M. for 3 experiments.
Figure 3
Figure 3
a. Cell viability of doxorubicin treated SCC cell lines following pretreatment with anti-miR-98™ and pre-miR-98™. The SCC-4 cell line was grown under normoxia or hypoxia and transfected with anti-miR-98™ or pre-miR-98™. The cell line was then challenged with varying doses of doxorubicin as described in Methods. The surviving fraction of cells as a percentage of control was determined using the MTT assay. Cell lines grown in normoxic conditions revealed greater percent of surviving cells when treated with pre-mir-98™ (●) compared to controls (▼) and anti-miR-98™ (○) transfected cells. (p ≤ 0.05). There was no significant difference between cell lines treated with anti-miR-98™ and controls. Cell lines grown under hypoxic conditions and transfected with pre-miR-98™ (▽) showed a slight increase in surviving cells compared to control cell lines (■) and Anti-miR-98™ (□) transfected cell lines (p ≤ 0.05). There was no significant difference between control and anti-miR-98™ transfected cell lines. Similar results were observed for SCC-9 and SCC-10B cell lines. The error bars represent S.E.M. for 3 experiments. b. Cell viability of cisplantin treated cell lines following pretreatment with anti-miR-98™ and pre-miR-98™. The SCC-4 cell line was grown under normoxic or hypoxic conditions and transfected with anti-miR-98™ while others were transfected with pre-miR-98™. The cell line was then challenged with varying doses of cisplatin as described in Methods. The surviving fraction of cells as a percentage of control was determined using the MTT assay. Cells grown in normoxic conditions revealed greater percent of surviving cells when treated with pre-mir-98™ (▼) compared to controls (●) and anti-miR-98™ (▽) transfected cell lines (p ≤ 0.05). There was no significant difference between cells treated with anti-miR-98™ and controls. Cell lines grown under hypoxic conditions and transfected with pre-miR-98™ (■) showed no significant difference in the percent of surviving cells compared to control cells (○) and Anti-miR-98™ (□) transfected cell lines. Likewise, there was no significant difference between control and anti-miR-98™ transfected cell lines. Similar results were observed for SCC-9 and SCC-10B cell lines. The error bars represents S.E.M. for 3 experiments.
Figure 4
Figure 4
TargetScanS miRNA98 target sites for HMGA2. In addition to 7mer sites, TargetScanS predicts 8mer sites defined as: An exact match to positions 2–8 of the mature miRNA (the seed + position 8) with a downstream 'A' across from position 1 of the miRNA. In addition to 8mer sites, TargetScanS predicts 7mer sites of two types: 7mer-m8: An exact match to positions 2–8 of the mature miRNA (the seed + position 8) and 7mer-1A: An exact match to positions 2–7 of the mature miRNA (the seed) with a downstream 'A' across from position 1 of the miRNA.
Figure 5
Figure 5
TargetScanS has-let-7g target sites for HMGA2. In addition to 7mer sites, TargetScanS predicts 8mer sites defined as: An exact match to positions 2–8 of the mature miRNA (the seed + position 8) with a downstream 'A' across from position 1 of the miRNA. In addition to 8mer sites, TargetScanS predicts 7mer sites of two types: 7mer-m8: An exact match to positions 2–8 of the mature miRNA (the seed + position 8) and 7mer-1A: An exact match to positions 2–7 of the mature miRNA (the seed) with a downstream 'A' across from position 1 of the miRNA.
Figure 6
Figure 6
TargetScanS has-let-7e target sites for HMGA2. In addition to 7mer sites, TargetScanS predicts 8mer sites defined as: An exact match to positions 2–8 of the mature miRNA (the seed + position 8) with a downstream 'A' across from position 1 of the miRNA. In addition to 8mer sites, TargetScanS predicts 7mer sites of two types: 7mer-m8: An exact match to positions 2–8 of the mature miRNA (the seed + position 8) and 7mer-1A: An exact match to positions 2–7 of the mature miRNA (the seed) with a downstream 'A' across from position 1 of the miRNA.
Figure 7
Figure 7
TargetScanS has-let-7i target sites for HMGA2. In addition to 7mer sites, TargetScanS predicts 8mer sites defined as: An exact match to positions 2–8 of the mature miRNA (the seed + position 8) with a downstream 'A' across from position 1 of the miRNA. In addition to 8mer sites, TargetScanS predicts 7mer sites of two types: 7mer-m8: An exact match to positions 2–8 of the mature miRNA (the seed + position 8) and 7mer-1A: An exact match to positions 2–7 of the mature miRNA (the seed) with a downstream 'A' across from position 1 of the miRNA.
Figure 8
Figure 8
a. Effect of hypoxia and normoxia on the protein expression of HMGA2 by Western blot. SCC-4, SCC-9 and SCC-10B cell lines were grown under normoxic and hypoxic conditions (1% O2), harvested and the levels of HMGA2 assayed by Western blot, as described in Methods. b. Effect of HMGA2 small interfering RNA on cell viability following doxorubicin treatment in SCC cell lines. The SCC-4 cell line grown under normoxic conditions was transfected with oligonucleotide encoding HMGA2 small interfering RNA or a scramble siRNA sequence. The dose dependent effects of doxorubicin on cell viability was measured by MTT assays. The differences between control cell line and cell lines treated with HMGA2 siRNA was statistically significant (p ≤ 0.01) as determined by Student's t test. The panel below depicts the effects of HMGA2 siRNA and the scramble counterpart on HMGA2 in Western blot. Similar results were obtained for SCC-9 and SCC-10B cell lines. The error bars represent the S.E.M. for 3 experiments.
Figure 9
Figure 9
a. The effect of pre-miR-98™ and anti-miR-98™ on the protein levels of HMGA2 during normoxia and hypoxia. The SCC-4 cell line was transfected with pre-miR-98™ or Anti-miR-98™ and grown under hypoxic or normoxic conditions. Similar results were obtained for SCC-10B and SCC-9 cell lines (not shown). b. The effect of pre-miR-98™ and anti-mir-98™ on the relative expression of HMGA2 during normoxia and hypoxia. The mRNA expression of HMGA2 was significantly diminished both during normoxia and hypoxia following transfection with pre-miR-98™ (** p ≤ 0.01). Anti-miR98™ transfection had a significant effect on enhancing HMGA2 expression when cells lines were grown during normoxia (*p ≤ 0.05) but were ineffective under hypoxic conditions. The mRNA expression of the control levels of each condition was set as 1. The error bars represents S.E.M. for 3 experiments.

References

    1. Reeves R. Molecular biology of HMGA proteins: hubs of nuclear function. Gene. 2001;277:63–81. doi: 10.1016/S0378-1119(01)00689-8. - DOI - PubMed
    1. Boo LM, Lin HH, Chung V, Zhou B, Louie SG, O'Reilly MA, Yen Y, Ann DK. High mobility group A2 potentiates genotoxic stress in part through the modulation of basal and DNA damage-dependent phosphatidylinositol 3-kinase-related protein kinase activation. Cancer Res. 2005;65:6622–6630. doi: 10.1158/0008-5472.CAN-05-0086. - DOI - PubMed
    1. Reeves R, Beckerbauer L. HMGI/Y proteins: flexible regulators of transcription and chromatin structure. Biochim Biophys Acta. 2001;1519:13–29. - PubMed
    1. Zhou X, Benson KF, Przybysz K, Liu J, Hou Y, Cherath L, Chada K. Genomic structure and expression of the murine Hmgi-c gene. Nucleic Acids Res. 1996;24:4071–4077. doi: 10.1093/nar/24.20.4071. - DOI - PMC - PubMed
    1. Hirning-Folz U, Wilda M, Rippe V, Bullerdiek J, Hameister H. The expression pattern of the Hmgic gene during development. Genes Chromosomes Cancer. 1998;23:350–357. doi: 10.1002/(SICI)1098-2264(199812)23:4<350::AID-GCC10>3.0.CO;2-E. - DOI - PubMed

Publication types