

Hippocampal hypometabolism predicts cognitive decline from normal aging
- PMID: 17222480
- PMCID: PMC2430185
- DOI: 10.1016/j.neurobiolaging.2006.12.008
Hippocampal hypometabolism predicts cognitive decline from normal aging
Abstract
Objective: This longitudinal study used FDG-PET imaging to predict and monitor cognitive decline from normal aging.
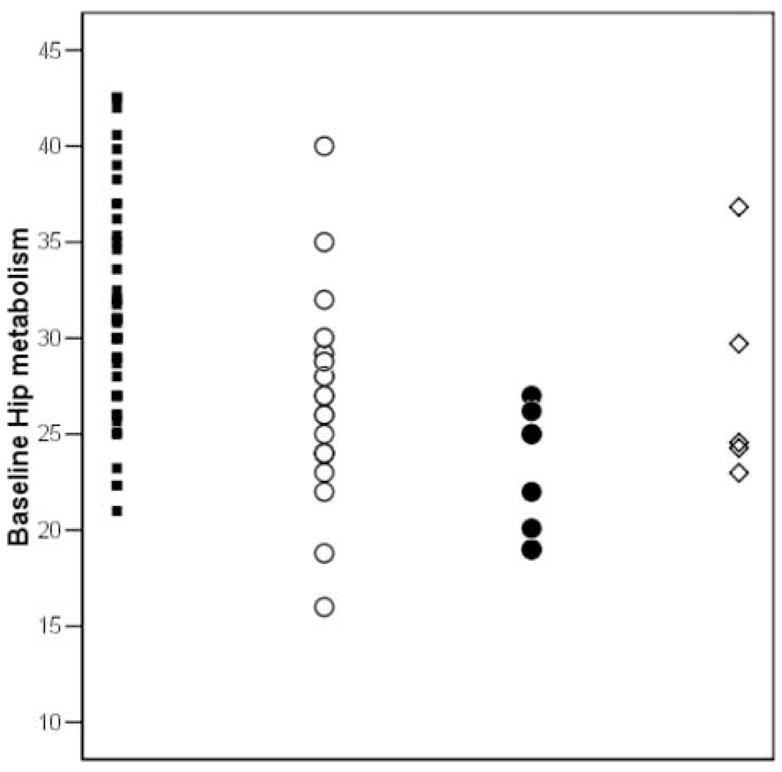
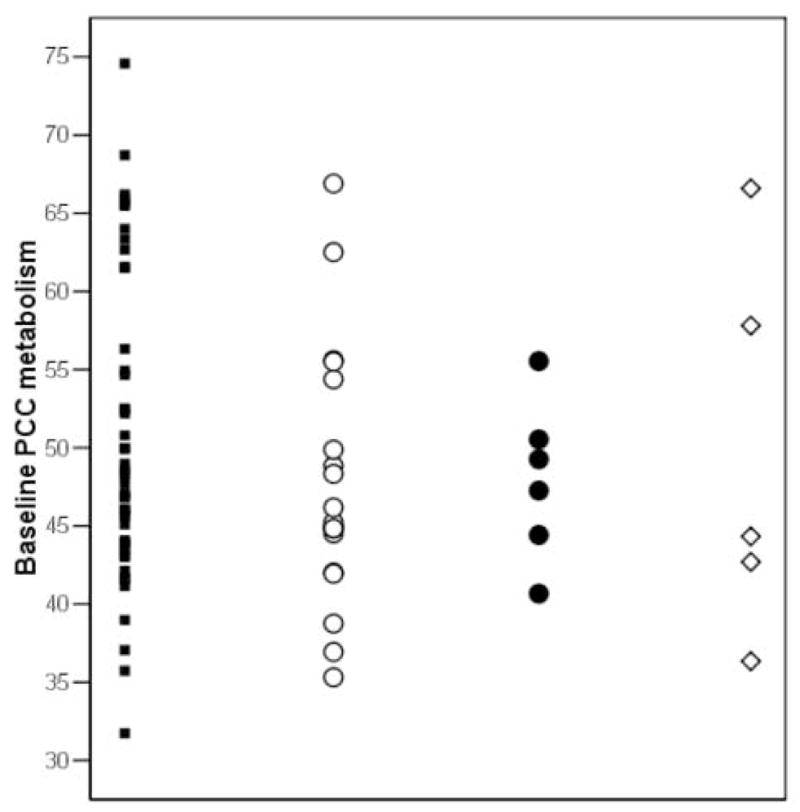
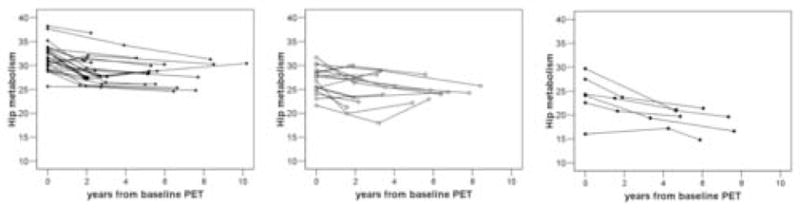
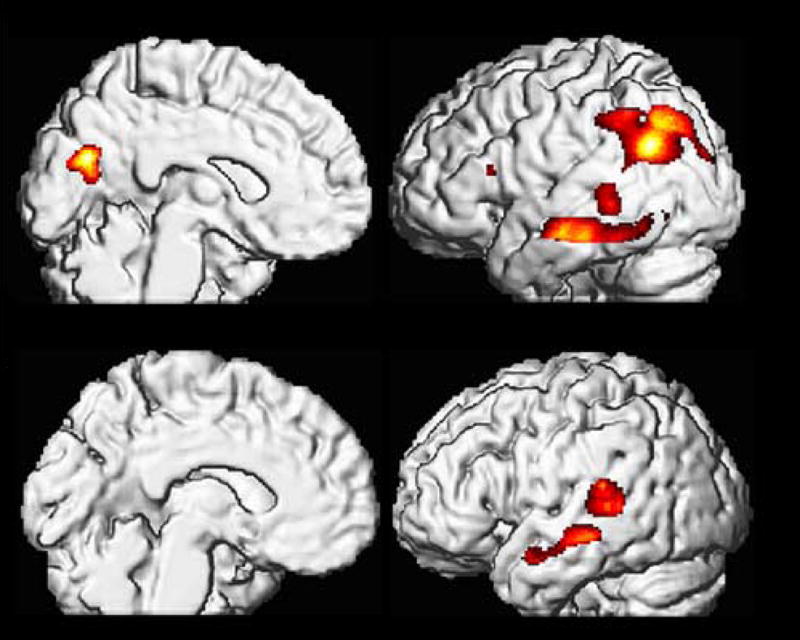
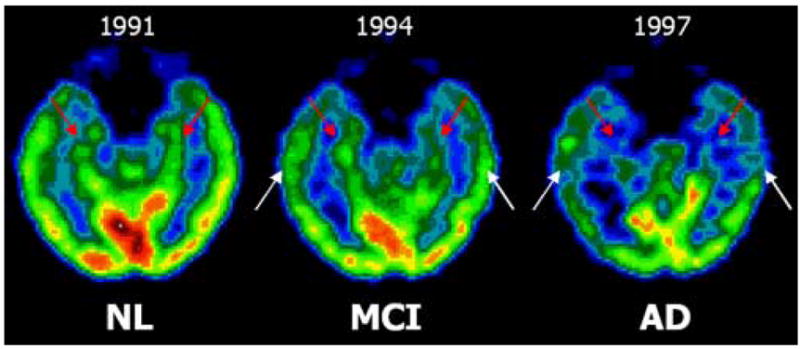
Methods: Seventy-seven 50-80-year-old normal (NL) elderly received longitudinal clinical examinations over 6-14 years (561 person-years, mean per person 7.2 years). All subjects had a baseline FDG-PET scan and 55 subjects received follow-up PET exams. Glucose metabolic rates (MRglc) in the hippocampus and cortical regions were examined as predictors and correlates of clinical decline.
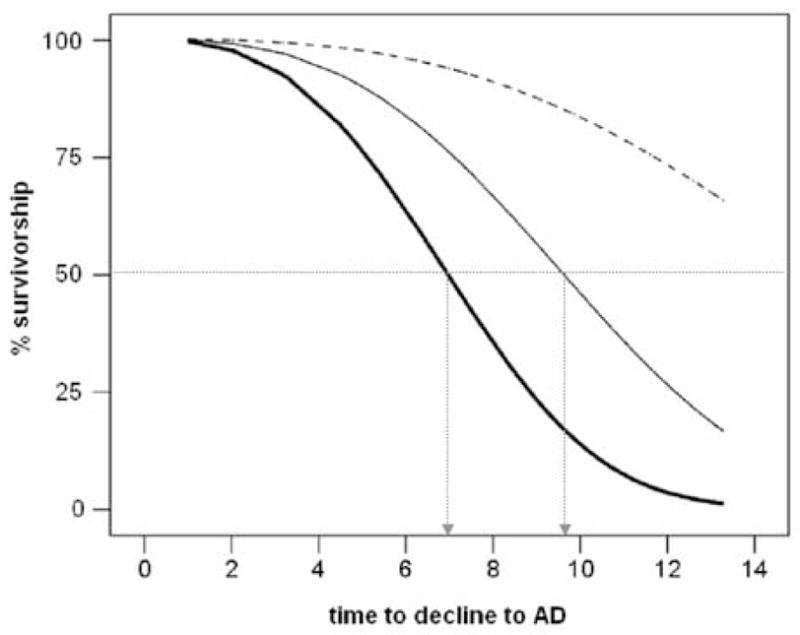
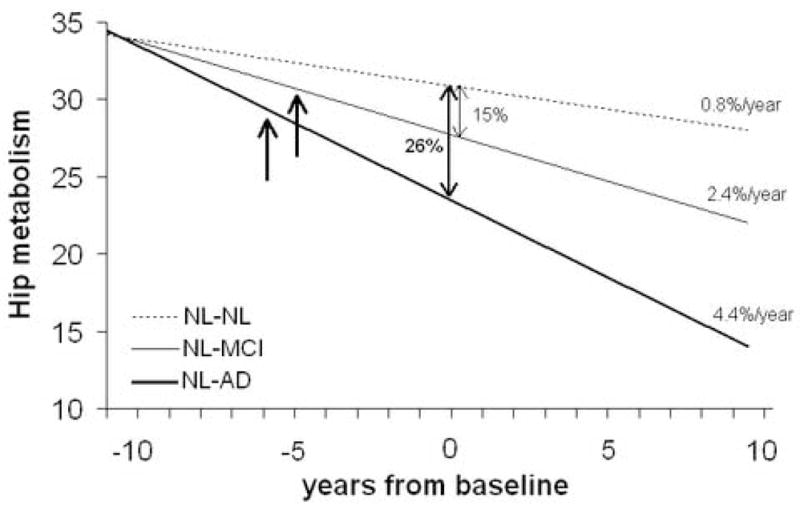
Results: Eleven NL subjects developed dementia, including six with Alzheimer's disease (AD), and 19 declined to mild cognitive impairment (MCI), on average 8 years after the baseline exam. The baseline hippocampal MRglc predicted decline from NL to AD (81% accuracy), including two post-mortem confirmed cases, from NL to other dementias (77% accuracy), and from NL to MCI (71% accuracy). Greater rates of hippocampal and cortical MRglc reductions were found in the declining as compared to the non-declining NL.
Conclusions: Hippocampal MRglc reductions using FDG-PET during normal aging predict cognitive decline years in advance of the clinical diagnosis. Future studies are needed to increase preclinical specificity in differentiating dementing disorders.
Conflict of interest statement
Figures
References
-
- Albin RL, Minoshima S, DAmato CJ, Frey KA, Kuhl DE, Sima AAF. Fluoro-deoxyglucose positron emission tomography in diffuse lewy body disease. Neurology. 1996;47:462–6. - PubMed
-
- American Psychiatric Association. Diagnostic and Statistical Manual of Mental Disorders. 4. Washington, D.C: American Psychiatric Association; 1994.
-
- Anchisi D, Borroni B, Franceschi M, Kerrouche N, Kalbe E, Beuthien-Beumann B, Cappa S, Lenz O, Ludecke S, Marcone A, Mielke R, Ortelli P, Padovani A, Pelati O, Pupi A, Scarpini E, Weisenbach S, Herholz K, Salmon E, Holthoff V, Sorbi S, Fazio F, Perani D. Heterogeneity of brain glucose metaboism in mild cognitive impairment and clinical progression to Alzheimer disease. Arch Neurol. 2005;62:1728–33. - PubMed
-
- Ball MJ, Hachinski V, Fox A, Kirshen AJ, Fisman M, Blume W, Kral VA, Fox H. A new definition of Alzheimer’s disease: A hippocampal dementia. Lancet. 1985;1:14–6. - PubMed
-
- Berent S, Giordani B, Foster N, Minoshima S, Lajiness-O’Neill R, Koeppe R, Kuhl DE. Neuropsychological function and cerebral glucose utilization in isolated memory impairment and Alzheimer’s disease. J Psychiat Res. 1999;33:7–16. - PubMed
Publication types
MeSH terms
Substances
Grants and funding
LinkOut - more resources
Full Text Sources
Medical
