. 2007 Jan;26(1):105-16.
doi: 10.1016/j.immuni.2006.12.004. Epub 2007 Jan 11.

Identification of a T lineage-committed progenitor in adult blood

Affiliations

Identification of a T lineage-committed progenitor in adult blood

Andreas Krueger et al. Immunity. 2007 Jan.

Abstract

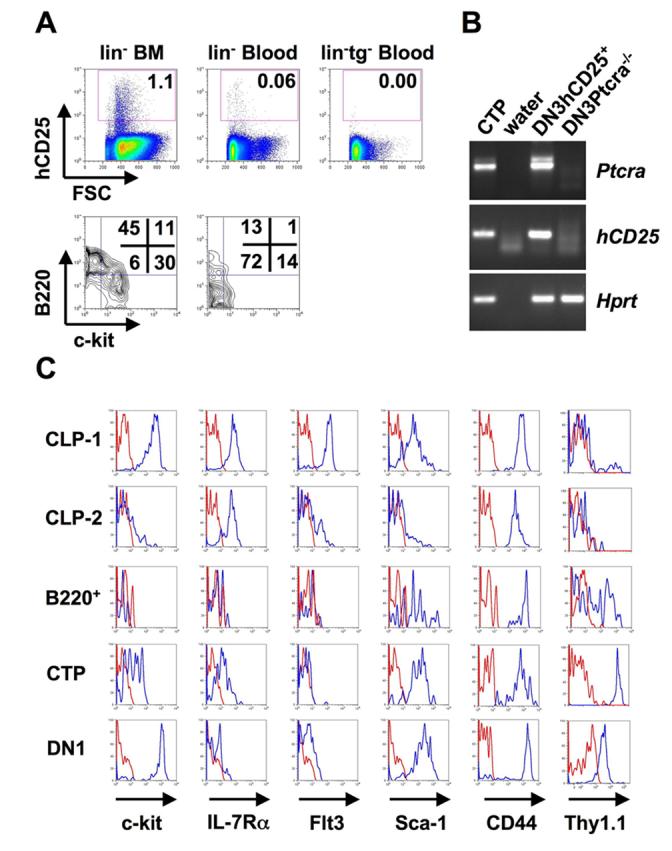
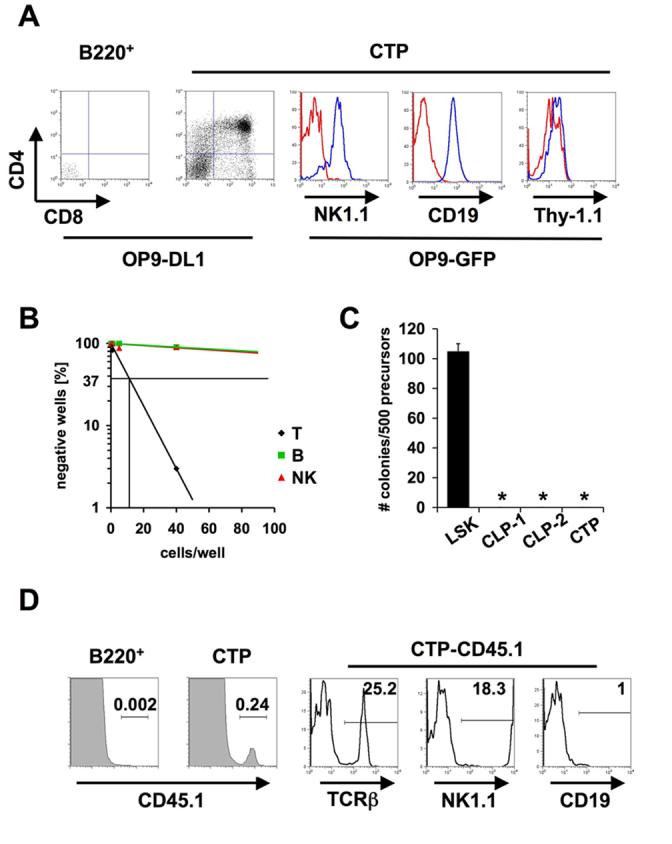
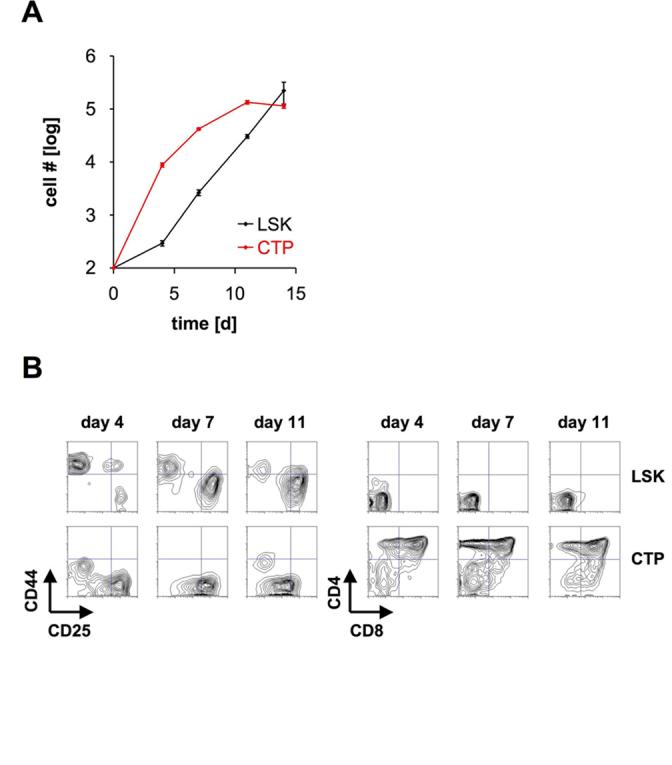
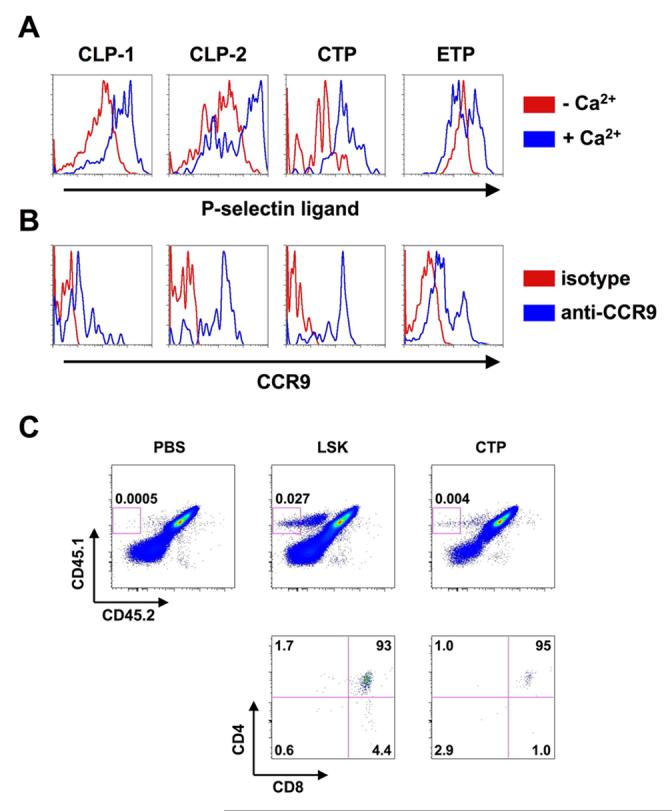
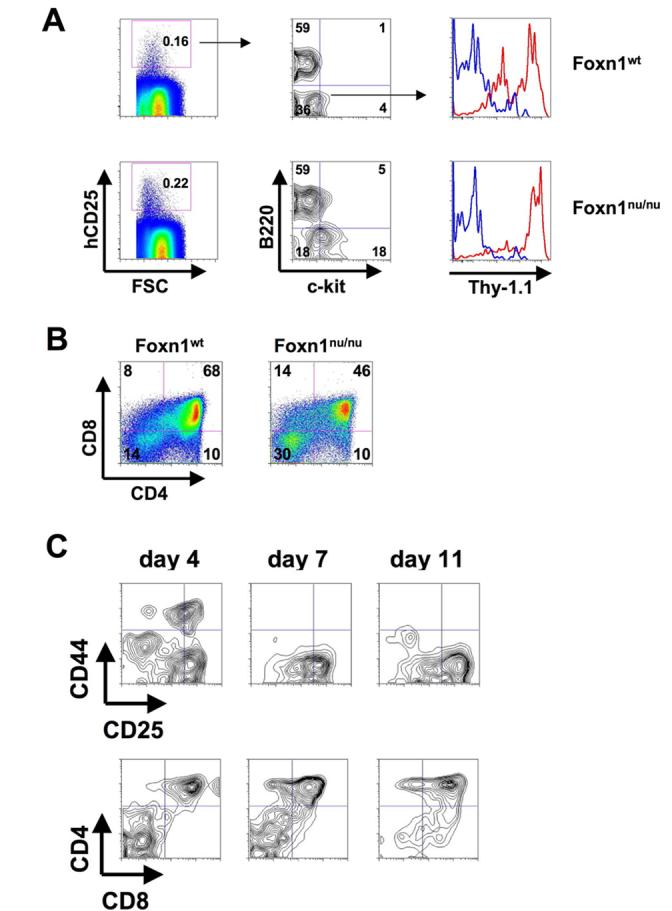
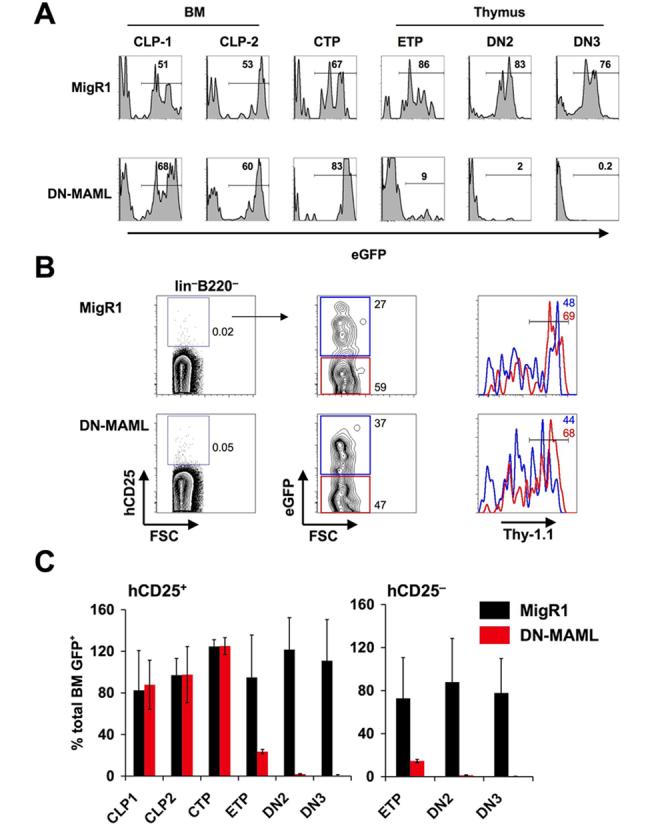
With help of a hCD25 reporter controlled by pre-T cell receptor alpha (Ptcra) regulatory elements, T cell precursors were identified in peripheral blood. Sca-1(+)IL-7Ralpha(+)Flt3(-) precursors that were c-kit(lo)Thy-1(hi) generated T lineage cells when cultured on OP9-DL1 stromal cells and upon transfer into Rag2(-/-)Il2rg(-/-) mice. No B cells were generated in vivo and only few in vitro. These cells, which we call circulating T cell progenitors (CTP), were found at the same frequency in Foxn1(nu/nu) thymus-deficient mice and wild-type mice, indicating that they were pre- rather than postthymic. Inhibition of Notch-dependent transcription in vivo reduced the frequency of intrathymic early T cell progenitors (ETP), but not CTP, indicating that the latter are less Notch dependent. Thus, CTP represent T lineage-committed T cell precursors linking extrathymic with intrathymic lymphopoiesis in adult mice.


Figures

Figure 1
Figure 1
Circulating linhCD25+ precursors. (A) Lineage depleted BM and blood cells from hCD25 transgenic and non-transgenic mice were stained for lineage markers, hCD25, c-kit and B220. The lower panels show the expression of c-kit and B220 of electronically gated linhCD25+ cells. Numbers in FACS plots indicate percentages of cells within gates or quadrants. (B) Expression of pre-TCRα in circulating linhCD25+ cells. RT-PCR was performed on 250 CTP cells. The same amount of cDNA from hCD25+ DN3 cells and DN3 cells from Ptcra−/− mice was used as positive and negative controls, respectively. One representative out of 2 independent experiments is shown. (C) Expression of surface markers on different linhCD25+ populations. BM CLP-1 (linhCD25+ckit+B220) and CLP-2 (linhCD25+c-kit−/loB220+) cells, blood linhCD25+B220+ cells (“B220+”) and CTP (linhCD25+B220) and thymic hCD25+ DN1 (linCD25CD44hihCD25+) cells were stained for c-kit, IL-7Rα, Flt3, Sca-1, CD44 and Thy-1.1. Histograms show expression levels of the respective surface markers (blue histograms) or unstained controls (red histograms) of electronically gated populations as indicated above. One representative out of 2 independent experiments is shown.
Figure 2
Figure 2
Developmental potential of circulating linhCD25+ cells. (A) Sorted linhCD25+B220 CTP and linhCD25+B220+ cells were co-cultured on OP9-DL1 or OP9-GFP cells for 18 days. Cells were stained for CD4, CD8, CD19, NK1.1 and Thy-1.1 and individual wells were analyzed by FACS. Blue histograms represent specific staining, red histograms represent unstained controls. 800 CD19+ (center) and 550 NK1.1+ (left) cells were recovered from starting cultures of 200 CTP. One representative out of three independent experiments is shown. (B) Limiting dilution analysis of T, B and NK potential of linhCD25+B220 cells (CTP) from peripheral blood. 1, 5 or 40 cells were directly sorted onto OP9-DL1 or OP9-GFP cells and analyzed by FACS after 18 days. Wells containing >50 (B and NK potential) or >100 (T potential) lineage positive cells were scored positive. (C) Analysis of myeloid potential of CTP cells. 500 CTP, BM derived LSK, CLP-1 and CLP-2 cells were cultured in methylcellulose containing SCF, IL-3, IL-6 and Erythropoietin and colonies were counted microscopically. (D) 1000 sorted CTP or 50 linhCD25+B220+ cells (CD45.1) were injected intravenously into irradiated Rag2−/−γc−/− recipients and spleens were analyzed 5 weeks after transfer by flow cytometry for expression of TCRβ, NK1.1 and CD19. One representative out of 2 independent experiments with 2 mice per group is shown.
Figure 3
Figure 3
Developmental progression and expansion of CTP. (A) 100 blood derived LSK cells and 100 CTP were sorted and co-cultured on OP9-DL1 cells. Cell numbers were assessed by FACS. Data are shown ± SEM (n=4). (B) 100 blood derived LSK cells and 100 CTP were co-cultured on OP9-DL1 cells. After 4, 7, and 11 days cells were analyzed for the expression of CD4 and CD8 (right panels) and electronically gated CD4CD8 DN cells for the expression of CD44 and CD25 (left panels). One representative out of 2 independent experiments is shown.
Figure 4
Figure 4
CTP express thymus homing markers and home to the thymus. (A) BM derived CLP-1 and CLP-2 cells, CTP (identified as described in Figure 1) and thymic ETP (hCD25+CD44+c-kithiCD25) were stained with P-selectin-Ig fusion proteins in the presence (blue histograms) and absence (red histograms) of free Ca2+. (B) BM derived CLP-1 and CLP-2 cells, CTP and thymic ETP were stained with anti-CCR9 antibodies (blue histograms). Red histograms represent staining with an isototype control. One representative out of 3 independent experiments is shown. (C) 1.5 × 10³ CTP or LSK cells from blood (CD45.1+CD45.2) were injected intravenously into sub-lethally irradiated (FVB × C57BL/6)F1 mice (CD45.1+CD45.2+). Thymi were analyzed 2 weeks after transfer by flow cytometry for expression of CD45.1, CD45.2, CD4 and CD8.
Figure 5
Figure 5
CTP are present in peripheral blood of Foxn1nu/nu mice. (A) CTP from hCD25 transgenic Foxn1nu/nu mice and hCD25 transgenic Foxn1wt littermates were analyzed by FACS. Cells were stained with antibodies against lineage markers, hCD25, c-kit, B220 and Thy-1.1 to reveal the frequency of linhCD25+ CTP. Numbers in FACS plots indicate percentages of cells within gates or quadrants. One representative out of 4 independent experiments is shown. (B) 200 CTP from hCD25 transgenic Foxn1nu/nu mice and hCD25 transgenic Foxn1wt littermates were sorted and co-cultured on OP9-DL1 cells. After 14 days cells were analyzed for the expression of CD4 and CD8. Numbers in FACS plots indicate percentages of cells within quadrants. One representative out of 3 independent experiments is shown (C) 100 CTP from hCD25 transgenic Foxn1nu/nu mice were sorted and co-cultured on OP9-DL1 cells. After 4, 7, and 11 days cells were analyzed for the expression of CD4 and CD8 (lower panels) and electronically gated CD4CD8 DN cells for the expression of CD44 and CD25 (upper panels). One representative out of 2 independent experiments is shown.
Figure 6
Figure 6
CTP do not require Notch-induced transcription. Sorted lineage negative cells from hCD25 transgenic BM were infected with DN-MAML or MigR1 control retrovirus and transferred into irradiated hosts. BM, peripheral blood and thymus were analyzed by FACS 6 - 10 weeks after transfer. Numbers in histograms indicate the frequency of eGFP+ cells. (A) eGFP expression in different populations of one representative experiment of 6 mice per group. (B) Analysis of Thy-1.1 expression in DN-MAML or MigR1 transduced blood derived linB220c-kitlo cells. Numbers in FACS plots indicate percentages of cells within gates or quadrants. Blue gates and histograms indicate eGFP+ cells; red histograms indicate eGFP cells. (C) Statistical analysis of 4 independent experiments. The percentage of eGFP positive cells was normalized to the percentage of eGFP positive cells of total BM for each independent experiment. Data are shown ± SEM.

Comment in

References

    1. Adolfsson J, Borge OJ, Bryder D, Theilgaard-Monch K, Astrand-Grundstrom I, Sitnicka E, Sasaki Y, Jacobsen SE. Upregulation of Flt3 expression within the bone marrow Lin(−)Sca1(+)c-kit(+) stem cell compartment is accompanied by loss of self-renewal capacity. Immunity. 2001;15:659–669. - PubMed
    1. Aifantis I, Borowski C, Gounari F, Lacorazza HD, Nikolich-Zugich J, von Boehmer H. A critical role for the cytoplasmic tail of pTalpha in T lymphocyte development. Nat Immunol. 2002;3:483–488. - PubMed
    1. Allman D, Sambandam A, Kim S, Miller JP, Pagan A, Well D, Meraz A, Bhandoola A. Thymopoiesis independent of common lymphoid progenitors. Nat Immunol. 2003;4:168–174. - PubMed
    1. Artavanis-Tsakonas S, Rand MD, Lake RJ. Notch signaling: cell fate control and signal integration in development. Science. 1999;284:770–776. - PubMed
    1. Balciunaite G, Ceredig R, Rolink AG. The earliest subpopulation of mouse thymocytes contains potent T, significant macrophage, and natural killer cell but no B-lymphocyte potential. Blood. 2005;105:1930–1936. - PubMed

Publication types

MeSH terms

Substances