Clinical Trial
. 2007 Jan;11(1):83-95.
doi: 10.1016/j.ccr.2006.11.021.

AZD2171, a pan-VEGF receptor tyrosine kinase inhibitor, normalizes tumor vasculature and alleviates edema in glioblastoma patients

Affiliations
Clinical Trial

AZD2171, a pan-VEGF receptor tyrosine kinase inhibitor, normalizes tumor vasculature and alleviates edema in glioblastoma patients

Tracy T Batchelor et al. Cancer Cell. 2007 Jan.

Abstract

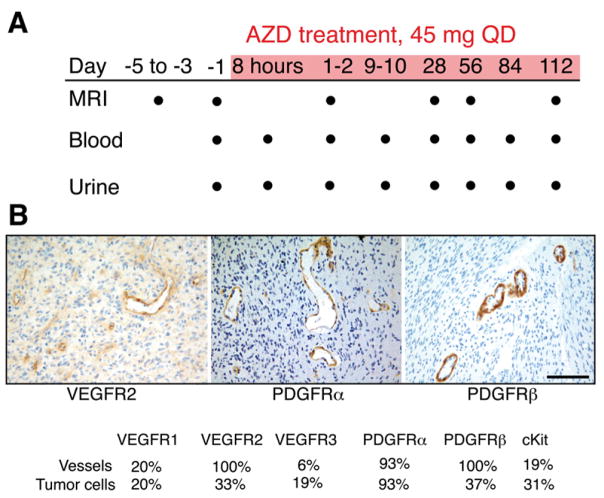
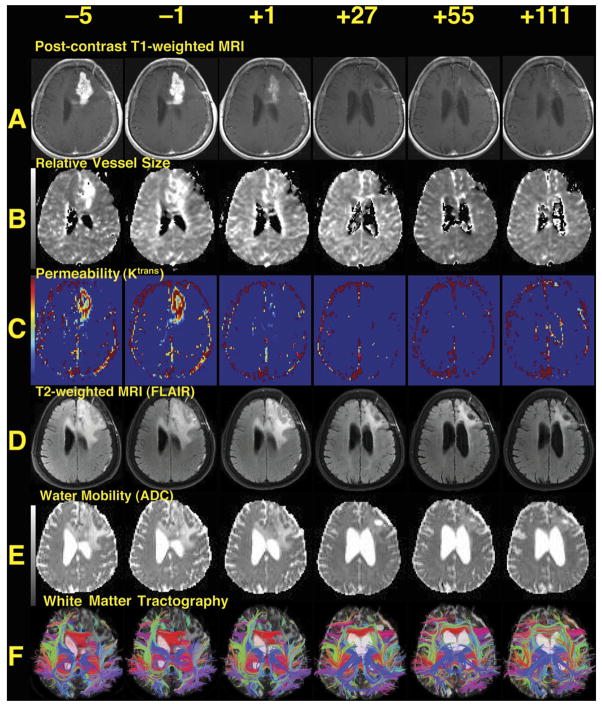
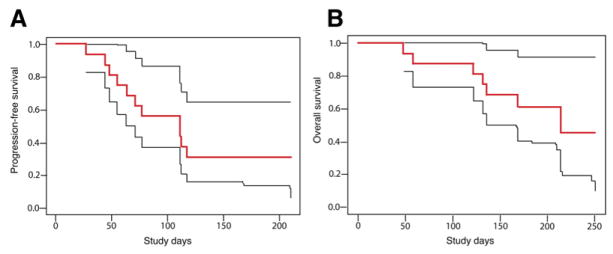
Using MRI techniques, we show here that normalization of tumor vessels in recurrent glioblastoma patients by daily administration of AZD2171-an oral tyrosine kinase inhibitor of VEGF receptors-has rapid onset, is prolonged but reversible, and has the significant clinical benefit of alleviating edema. Reversal of normalization began by 28 days, though some features persisted for as long as four months. Basic FGF, SDF1alpha, and viable circulating endothelial cells (CECs) increased when tumors escaped treatment, and circulating progenitor cells (CPCs) increased when tumors progressed after drug interruption. Our study provides insight into different mechanisms of action of this class of drugs in recurrent glioblastoma patients and suggests that the timing of combination therapy may be critical for optimizing activity against this tumor.


Figures

Figure 1
Figure 1. Design of Clinical Trial and Target Validation by Immunohistochemistry
(A) Trial schema. Dots indicate time points of data collection. AZD2171 was administered during the period shaded red. (B) Representative immunohistochemistry of glioblastoma endothelium. As expected, VEGFR2 and PDGFRα are expressed in the endothelial cells. Interestingly, PDGFRβ is also highly expressed in endothelial cells. (Bar represents 100 μm for all images.)
Figure 2
Figure 2. Representative Images from the Best-Responding Patient, Patient 9
(A) T1-weighted anatomic images after intravenous administration of a contrast agent (gadolinium-DTPA), demonstrating a region of bright signal corresponding to the recurrent brain tumor in the left frontal lobe shrinking over time (all images are displayed per standard radiographic convention). Note also the decreased mass effect on the left lateral ventricle. (B) Map of relative microvessel size, also showing decrease over time. (C) Maps of Ktrans, a measure of blood-brain barrier permeability. Note the substantial change after the first dose. (D) T2-weighted images acquired with a fluid-attenuated inversion recovery sequence (FLAIR), where edema is seen surrounding the tumor enhancement evident in (A), also decreasing over time. (E) Images of apparent diffusion coefficient (ADC) demonstrating water mobility, which identifies areas of vasogenic edema as high (bright) signal surrounding the region of enhancing tumor; these also reduce over time. The displacement of the ventricle is also reduced over time. (F) Tractography. These images demonstrate directional water mobility suggesting the presence of white matter tracts. As the vasogenic edema decreases and the mass effect subsides, these white matter tracts become more evident. A movie of day −1 and day 28 time points is available in the Supplemental Data (Movie S1).
Figure 3
Figure 3. Representative Images from a Moderately Responding Patient
(A–F) The types of images are the same as in Figure 2. Typical of most patients, there was substantial and prolonged reduction of enhancement and peritumoral edema, with some rebound of vessel size at day 55.
Figure 4
Figure 4. Representative Images from the Worst-Responding Patient
(A–F) The types of images are the same as in Figure 2. This patient had no substantial reduction in permeability, mass effect, or vessel size. A slight decrease in edema is evident on the FLAIR and ADC images at day 27, but this reverts by day 55.
Figure 5
Figure 5. Changes in Imaging Parameters over Time
(A) Median values for contrast-enhanced T1-weighted tumor volume (CE-T1), vessel size (VS), and permeability (P) of the tumor over time as measured by an independent expert. Day −1 was set as 100% in all lesions, and changes during AZD2171 treatment were plotted for all 16 patients. Note the rebound of CE-T1 volume and vessel size after day 28, which indicates a partial closure of the normalization window. (B) Median values of T2-weighted abnormality volume measured in fluid-attenuated inversion recovery images (FLAIR), apparent diffusion coefficient (ADC), and extracellular-extravascular volume fraction (ve) prior to and during treatment showing a sustained decrease of edema while taking AZD2171. (*p < 0.05 for values compared with day −1; #p < 0.05 for values compared with day +1. For full measurement details see Table S3.)
Figure 6
Figure 6. Kaplan-Meier Survival Distributions
(A) Progression-free survival and (B) overall survival in sixteen recurrent glioblastoma patients receiving AZD2171 (bold red lines) accompanied by upper and lower 95% confidence limits (thin black lines).
Figure 7
Figure 7. Reversibility of Normalization
(A) Vascular and volume changes as a function of time in a patient who did not take drug from days 43 through 56 and was imaged on day 55 (shown as drug holiday). T1-weighted anatomic images after intravenous administration of gadolinium-DTPA, similar to Figure 2. Note that at day 55 there is a rebound in tumor enhancement, which decreases again after restarting the drug as seen on follow-up imaging on day 110. In this patient, maps of relative vessel size (similar to Figure 1C) also show fluctuation with the drug holiday and resumption of AZD2171 treatment. (B) Measurements of imaging parameters confirm the reversibility of vascular normalization by drug interruption followed by renormalization after AZD2171 is resumed.

Comment in

Similar articles

Cited by

References

    1. Aghi M, Cohen KS, Klein RJ, Scadden DT, Chiocca EA. Tumor stromal-derived factor-1 recruits vascular progenitors to mitotic neovasculature, where microenvironment influences their differentiated phenotypes. Cancer Res. 2006;66:9054–9064. - PubMed
    1. Ansiaux R, Baudelet C, Jordan BF, Beghein N, Sonveaux P, DeWever J, Martinive P, Gregoire V, Feron O, Gallez B. Thalidomide radiosensitizes tumors through early changes in the tumor microenvironment. Clin Cancer Res. 2005;11:743–750. - PubMed
    1. Benner T, Wisco JJ, van der Kouwe AJ, Fischl B, Vangel MG, Hochberg FH, Sorensen AG. Comparison of manual and automatic section positioning of brain MR images. Radiology. 2006;239:246–254. - PubMed
    1. Bertolini F, Shaked Y, Mancuso P, Kerbel RS. The multifaceted circulating endothelial cell in cancer: towards marker and target identification. Nat Rev Cancer. 2006;6:835–845. - PubMed
    1. Boxerman JL, Schmainda KM, Weisskoff RM. Relative cerebral blood volume maps corrected for contrast agent extravasation significantly correlate with glioma tumor grade, whereas uncorrected maps do not. AJNR Am J Neuroradiol. 2006;27:859–867. - PMC - PubMed

Publication types

MeSH terms