. 2007 Apr 1;73(7):1001-12.
doi: 10.1016/j.bcp.2006.11.028. Epub 2006 Dec 10.

Matrix metalloproteinase-7-catalyzed release of HB-EGF mediates deoxycholyltaurine-induced proliferation of a human colon cancer cell line

Affiliations

Matrix metalloproteinase-7-catalyzed release of HB-EGF mediates deoxycholyltaurine-induced proliferation of a human colon cancer cell line

Kunrong Cheng et al. Biochem Pharmacol. .

Abstract

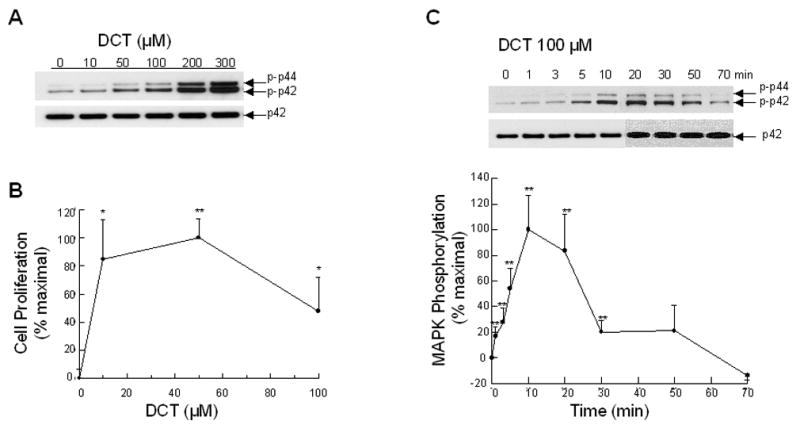
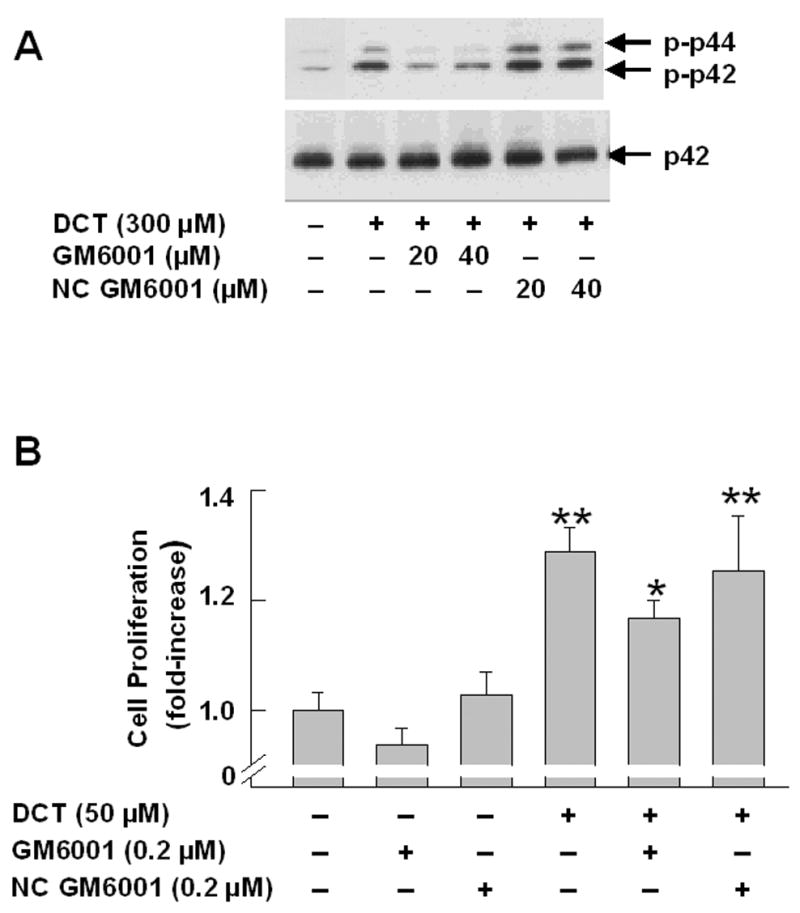
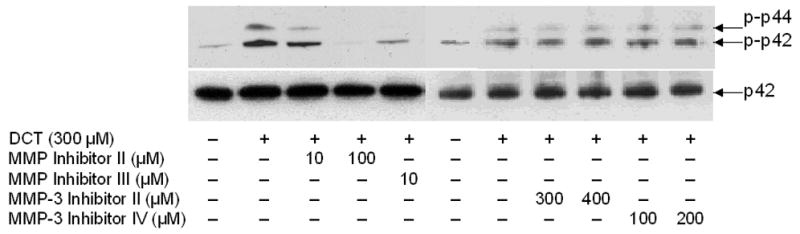
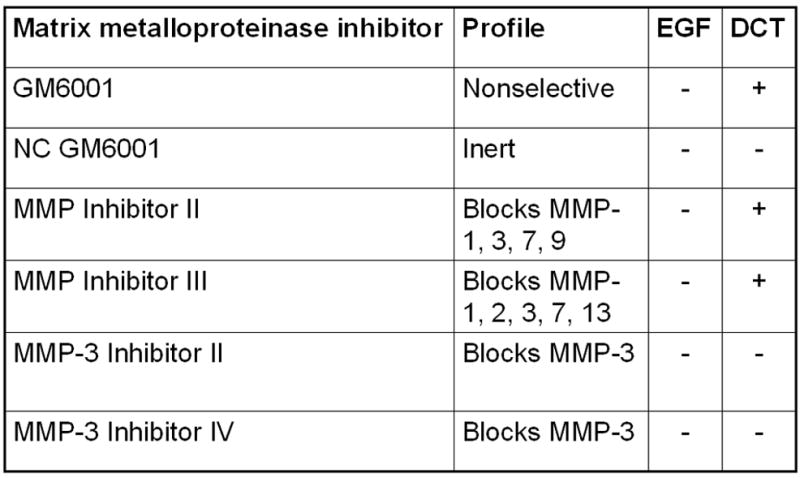
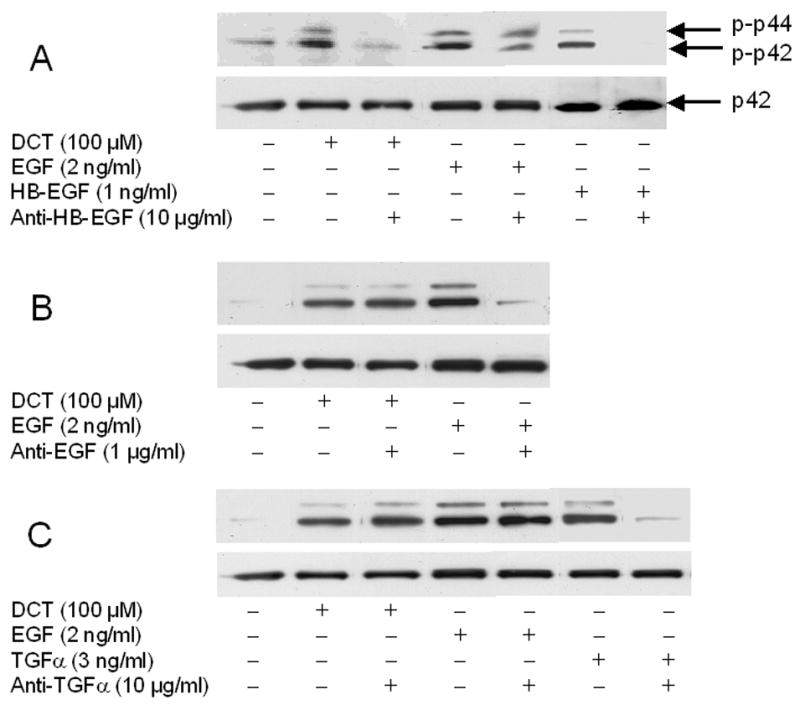
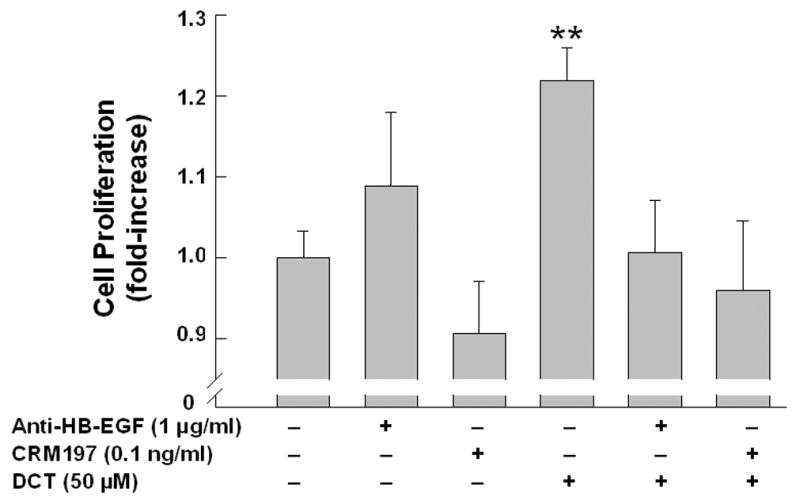
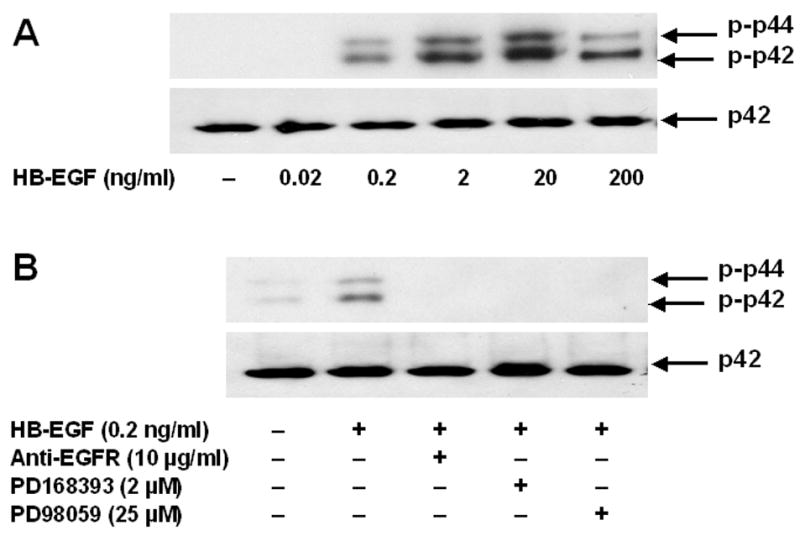
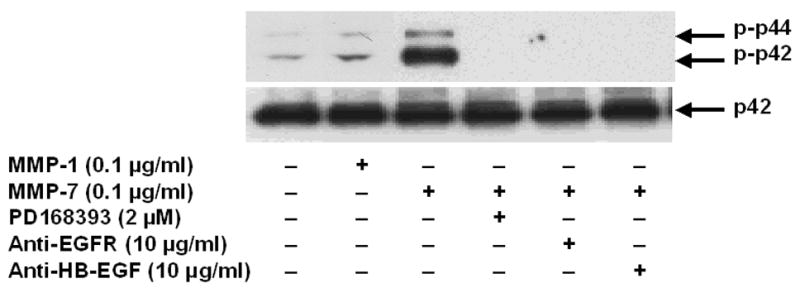
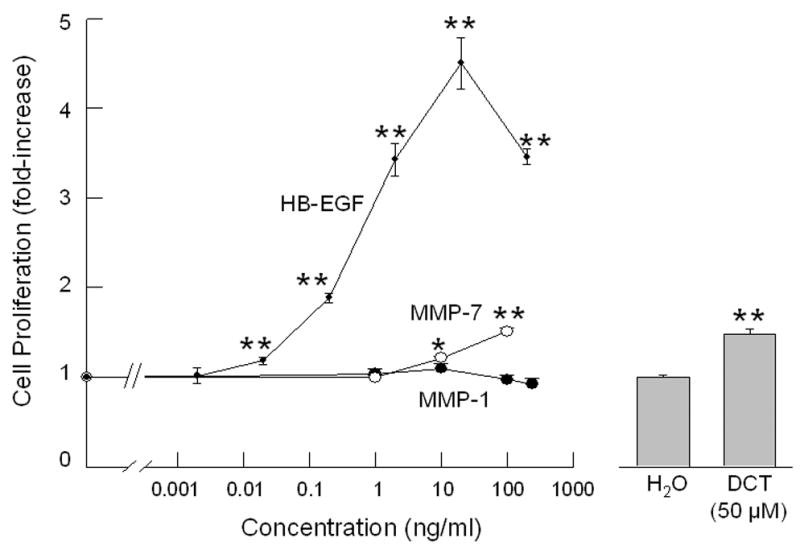
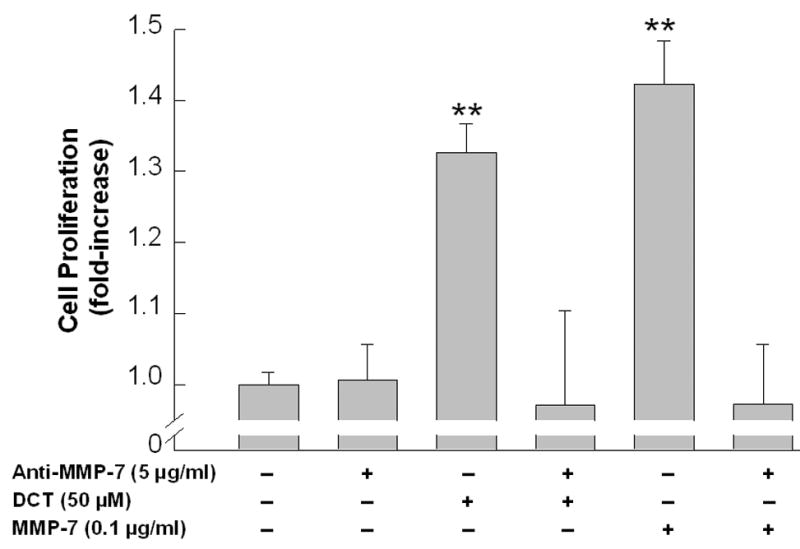
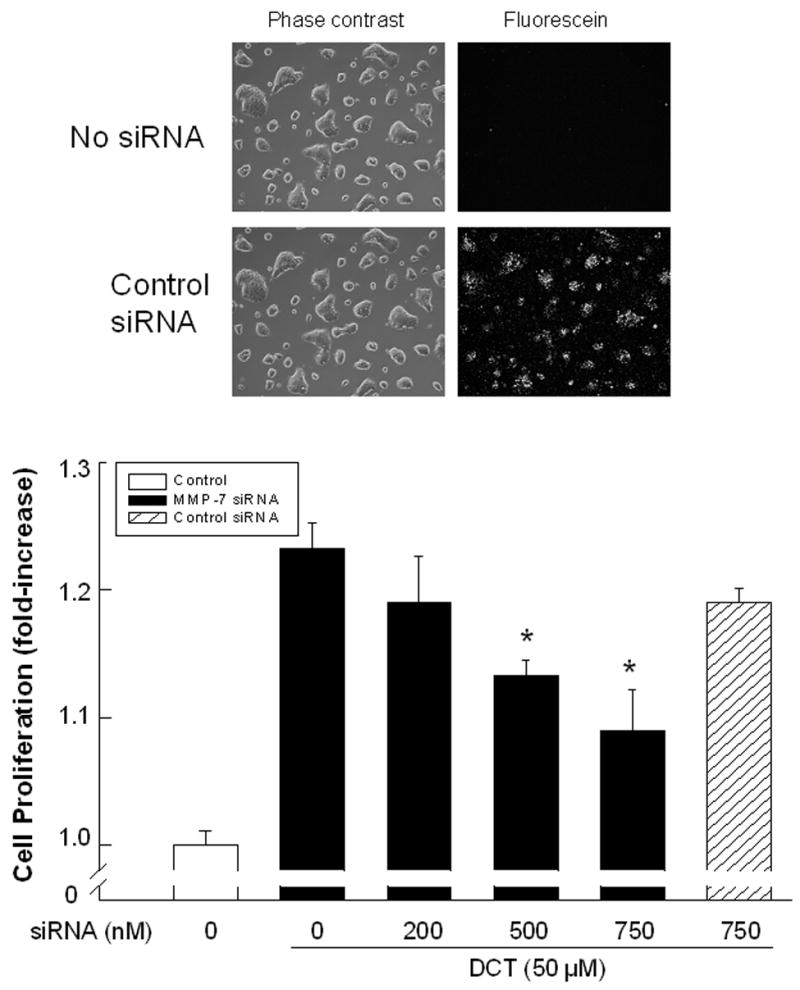
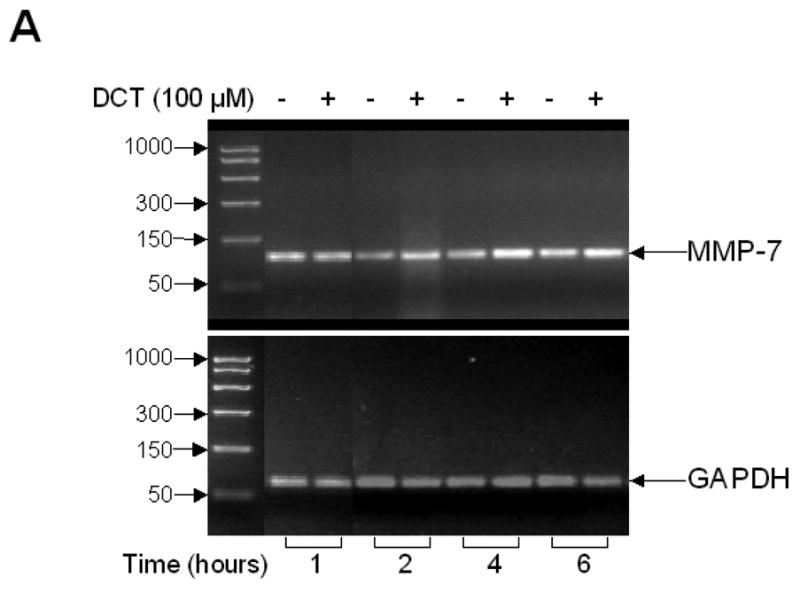
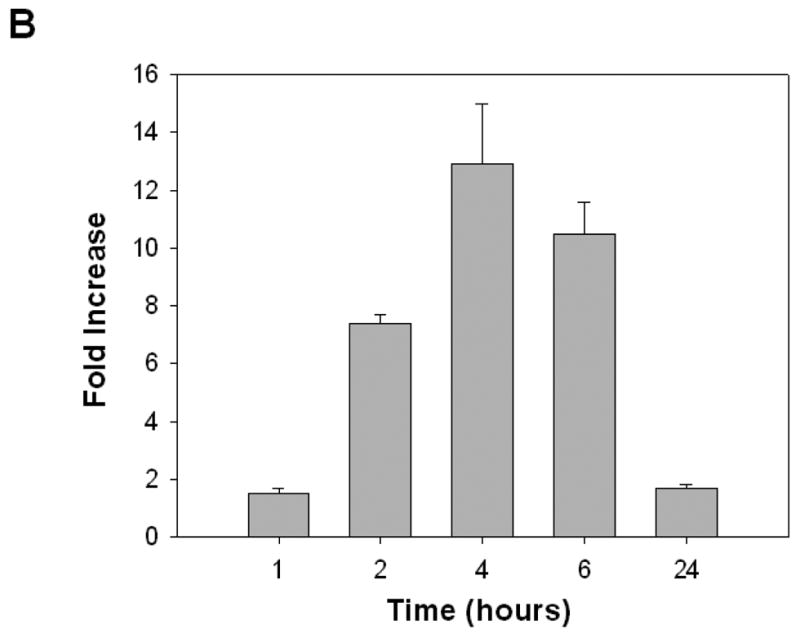
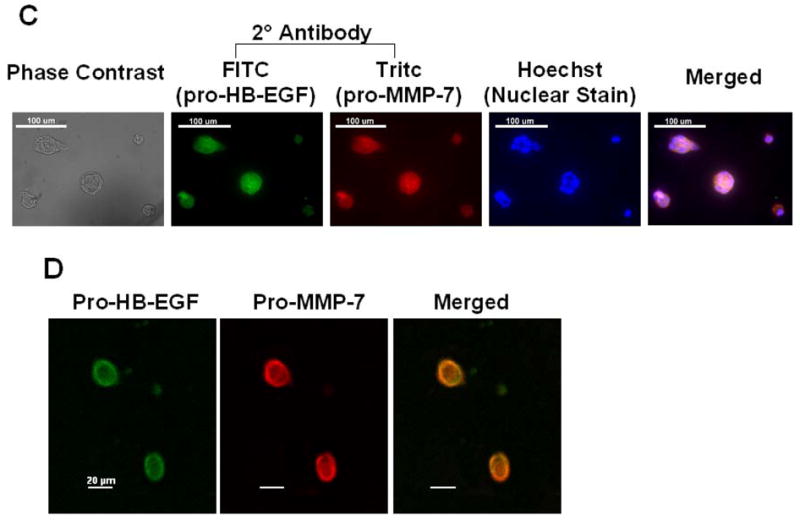
Prior evidence indicates that bile acids stimulate colon cancer cell proliferation by muscarinic receptor-induced transactivation of epidermal growth factor receptors (EGFR). To explore further the mechanism underlying this action, we tested the hypothesis that bile acids activate a matrix metalloproteinase (MMP) that catalyzes release of an EGFR ligand. Initial studies showed that non-selective MMP inhibitors blocked the actions of deoxycholyltaurine (DCT), thereby indicating a role for MMP-catalyzed release of an EGFR ligand. DCT-induced cell proliferation was reduced by increasing concentrations of EGFR kinase inhibitors, by antibodies to the ligand binding domain of EGFR, by neutralizing antibodies to heparin binding-EGF-like growth factor (HB-EGF) and by CRM197, an inhibitor of HB-EGF release. These findings and our observations with more selective MMP inhibitors suggested that MMP-7, an enzyme known to release HB-EGF, plays a key role in mediating bile acid-induced H508 colon cancer cell proliferation. We observed that recombinant HB-EGF and MMP-7 mimicked both the signaling and proliferative actions of bile acids. Strikingly, reducing MMP-7 expression with either neutralizing antibody or small interfering RNA attenuated the actions of DCT. MMP-7 expression in H508 cells was confirmed using quantitative reverse transcription PCR. DCT stimulated a greater than 10-fold increase in MMP-7 gene transcription. Co-localization of pro-MMP-7 and pro-HB-EGF at the cell surface (immunofluorescence microscopy) was demonstrated, indicating proximity of the enzyme to its substrate. These findings provide strong evidence that in H508 human colon cancer cells, DCT-induced transactivation of EGFR is mediated by MMP-7-catalyzed release of the EGFR ligand HB-EGF.


Figures

Figure 1
Figure 1. Dose-response and time-course for the signaling and proliferative actions of DCT on H508 colon cancer cells
A. Dose-response for DCT-induced p44/42 MAPK phosphorylation. H508 cells were treated with the indicated concentrations of DCT for 10 minutes at 37°C. p44/42 MAPK activity was determined by immunoblotting with antibodies specific for phosphorylated p44/42 MAPK. The quantity of protein added was verified by immunoblotting with antibodies specific for total p42 MAPK. Results are representative of 5 separate experiments. B. Dose-response for DCT-induced cell proliferation. H508 cells were incubated for 5 days at 37°C with the indicated concentrations of DCT. Cell proliferation was determined by the sulforhodamine blue (SRB) colorimetric assay [33]. Results are expressed as mean ± SEM of at least 5 separate experiments. *,**P < 0.05 and 0.005, respectively, vs unstimulated cells. C. Time-course for DCT-induced p44/42 MAPK phosphorylation. H508 cells were treated with 100 μM DCT for 70 minutes at 37°C and p44/42 MAPK activity was determined by immunoblotting at the indicated times with antibodies specific for phosphorylated p44/42 MAPK. The quantity of protein added was verified by immunoblotting with antibodies specific for total p42 MAPK. A representative immunoblot is shown and the graph depicts quantitative densitometric analysis of at least 5 immunoblots. Results are expressed as mean ± SEM. **P < 0.005 vs unstimulated cells.
Figure 2
Figure 2. Actions of matrix metalloproteinase (MMP) inhibitors on bile acid-induced MAPK phosphorylation and stimulation of H508 cell proliferation
A. MAPK phosphorylation. H508 cells were treated with the indicated concentration of DCT for 10 minutes at 37°C, alone or with two concentrations of GM6001 and NC GM6001. p44/42 MAPK activity was determined by immunoblotting with antibodies specific for phosphorylated p44/42 MAPK. The quantity of protein added was verified by immunoblotting with antibodies specific for total p42 MAPK. Results are representative of 3 separate experiments. B. Cell proliferation. H508 cells were incubated with DCT, alone and with GM6001 or NC GM6001 for 5 days at 37°C. Cell proliferation was determined by the sulforhodamine blue (SRB) colorimetric assay [33]. Results are expressed as mean ± SEM of at least 3 experiments. *P < 0.05 vs cells stimulated with DCT alone. **P < 0.005 vs unstimulated cells. C. Actions of MMP Inhibitors II and III and MMP-3 Inhibitors II and IV on H508 cell proliferation. H508 cells were treated with 300 μM DCT for 10 minutes at 37°C, alone or with the indicated concentrations of MMP inhibitors II and III, and MMP-3 inhibitors II and IV. The quantity of protein added was verified by immunoblotting with antibodies specific for total p42 MAPK. Results are representative of 3 separate experiments. D. Profiles and actions of MMP inhibitors on EGF- and bile acid-induced phosphorylation of p44/42 MAPK in H508 human colon cancer cells. - indicates the inhibitor had no effect; + indicates inhibition by the inhibitor.
Figure 3
Figure 3. Effect of adding neutralizing EGFR ligand antibodies on DCT-induced p44/42 MAPK phosphorylation and H508 colon cancer cell proliferation
A–C. Effect of adding HB-EGF, EGF, and TGF-α antibodies on p44/42 MAPK phosphorylation. H508 cells were treated with DCT, EGF, HB-EGF and TGF-α for 10 minutes at 37°C, alone or with the EGFR ligand antibodies shown. p44/42 MAPK activity was determined by immunoblotting with antibodies specific for phosphorylated MAPK. The quantity of protein added was verified by immunoblotting with antibodies specific for total p42 MAPK. Results are representative of 3 separate experiments. D. Effect of adding HB-EGF antibodies and CRM197 on cell proliferation. H508 cells were incubated with DCT, alone and with antibody to HB-EGF or with CRM197 (0.1 ng/ml) for 5 days at 37°C. Cellular proliferation was determined by the sulforhodamine blue (SRB) colorimetric assay [33]. Results are mean ± SEM of 3 to 5 experiments. **P < 0.005 vs unstimulated cells.
Figure 4
Figure 4. Actions of recombinant HB-EGF on p44/42 MAPK phosphorylation in H508 colon cancer cells
A. Actions of increasing concentration of HB-EGF on p44/42 MAPK phosphorylation. H508 cells were treated with increasing concentrations of HB-EGF for 10 minutes at 37°C. p44/42 MAPK activity was determined by immunoblotting with antibodies specific for phosphorylated MAPK. The quantity of protein added was verified by immunoblotting with antibodies specific for total p42 MAPK. Results are representative of 3 separate experiments. B. Antibodies to the ligand-binding domain of EGFR, and EGFR (PD168393) and MEK (PD98059) inhibitors block HB-EGF-induced p44/42 MAPK phosphorylation. H508 cells were treated with the indicated concentration of HB-EGF for 10 minutes at 37°C, alone or in the presence of the indicated concentrations of antibodies and inhibitors. p44/42 MAPK activity was determined by immunoblotting with antibodies specific for phosphorylated MAPK. The quantity of protein added was verified by immunoblotting with antibodies specific for total p42 MAPK. Results are representative of 3 separate experiments.
Figure 5
Figure 5. MMP-7 mimics the actions of bile acids on H508 colon cancer cells
A. Effect of MMP-1 and MMP-7, alone or in the presence of an EGFR inhibitor and antibodies to EGFR and HB-EGF, on p44/42 MAPK phosphorylation. H508 cells were treated with MMP-7 (0.1 μg/ml) and MMP-1 (0.1 μg/ml), alone or in the presence of an EGFR inhibitor (PD168393, 2 μM), an anti-EGFR antibody (10 μg/ml) and an anti-HB-EGF neutralizing antibody (10 μg/ml), for 10 minutes at 37°C. p44/42 MAPK activity was determined by immunoblotting with antibodies specific for phosphorylated MAPK. The quantity of protein added was verified by immunoblotting with antibodies specific for total p42 MAPK. Results are representative of 3 separate experiments. B. Comparison of the efficacy of increasing concentrations of HB-EGF, MMP-7 and MMP-1, with that of DCT for stimulating H508 cell proliferation. Cells were incubated with increasing concentrations of MMP-7, MMP-1, and HB-EGF for 5 days at 37°C and stimulation of cell proliferation was compared to that observed with water and DCT. Results are mean ± SEM of 3 experiments. *,**P < 0.05 and 0.005, respectively vs unstimulated cells. The vertical axis (cell proliferation) is the same for the line drawing (left panel) and bar graph (right panel). C. MMP-7 antibodies inhibit the proliferative actions of MMP-7 and DCT on H508 colon cancer cells. Cells were incubated with DCT and MMP-7, alone and in the presence of antibody to MMP-7, for 5 days at 37°C. Cellular proliferation was determined by the sulforhodamine blue (SRB) colorimetric assay [33]. Results are mean ± SEM of 3 experiments. **P < 0.005 vs unstimulated cells. D. Transfection of cells with MMP-7 siRNA inhibits the proliferative actions of DCT. H508 cells were transfected with siRNA duplex oligos targeting human MMP-7 or a fluorescein-tagged nonspecific duplex oligo negative control. Two days following transfection, cells were incubated for an additional 5 days in FBS-free medium containing 50 μM DCT. The inset at the top shows cellular accumulation of fluorescent control siRNA. Cellular proliferation was determined by the sulforhodamine blue (SRB) colorimetric assay [33]. Results are mean ± SEM of 3 experiments. *P < 0.05 vs cells incubated with DCT alone.
Figure 6
Figure 6. Expression of MMP-7 and plasma membrane co-localization of pro-HB-EGF and pro-MMP-7 in H508 human colon cancer cells
A. Agarose gel (2%) of PCR products from quantitative reverse transcription-PCR in H508 cells confirms MMP-7 gene transcription and induction by DCT. H508 cells were cultured in serum-free media for 24 hrs prior to DCT (100 μM) treatment. Total RNA was isolated following harvest of cells at the indicated time points. DNA size markers (base pairs) are indicated at left with arrows. Arrows at right indicate PCR product for MMP-7 and the glyceraldehyde-3-phosphate dehydrogenase (GAPDH) control. B. DCT induces MMP-7 mRNA expression in H508 colon cancer cells. The level of MMP-7 mRNA was determined by quantitative real-time PCR as described in Materials and methods. Results are mean ± SEM of 3 experiments. C. Immunofluorescence microscopy. Left panel: Phase contrast microscopy of H508 colon cancer cells. Immunofluorescence localization in H508 colon cancer cells using pro-HB-EGF (FITC, green fluorescence) and pro-MMP-7 (Tritc, red fluorescence) antibodies is shown. Cell nuclei are stained with Hoechst (blue). Extreme right panel: Merged images of pro-HB-EGF, pro-MMP-7 and cell nuclei. Cytoplasmic co-localization of pro-HB-EGF and pro-MMP-7 is shown by light orange color. Scale bar = 100 μm. D. Confocal microscopy. Immunofluorescence staining of pro-HB-EGF (left, green fluorescence) and pro-MMP-7 (middle, red fluorescence) demonstrates cell surface co-localization (right, light orange fluorescence). Scale bar = 20 μm.

References

    1. Hill MJ. Bile acids and colorectal cancer: hypothesis. Eur J Cancer Prev. 1991;1:69–74. - PubMed
    1. Reddy BS, Wynder EL. Metabolic epidemiology of colon cancer. Fecal bile acids and neutral sterols in colon cancer patients and patients with adenomatous polyps. Cancer. 1977;39:2533–9. - PubMed
    1. Glinghammar B, Rafter J. Carcinogenesis in the colon: interaction between luminal factors and genetic factors. Eur J Cancer Prev. 1999;8:S87–S94. - PubMed
    1. Narisawa T, Magadia NE, Weisburger JH, Wynder EL. Promoting effect of bile acids on colon carcinogenesis after intrarectal instillation of N-methyl-N'-nitro-N-nitrosoguanidine in rats. J Natl Cancer Instit. 1974;53:1093–7. - PubMed
    1. Reddy BS, Narasawa T, Weisburger JH, Wynder EL. Promoting effect of sodium deoxycholate on colon adenocarcinomas in germfree rats. J Natl Cancer Instit. 1976;56:441–2. - PubMed

Publication types

MeSH terms

Substances