. 2007 Mar;16(2):209-16.
doi: 10.1016/j.niox.2006.11.002. Epub 2006 Dec 5.

Nitric oxide red blood cell membrane permeability at high and low oxygen tension

Affiliations

Nitric oxide red blood cell membrane permeability at high and low oxygen tension

Kris T Huang et al. Nitric Oxide. 2007 Mar.

Abstract

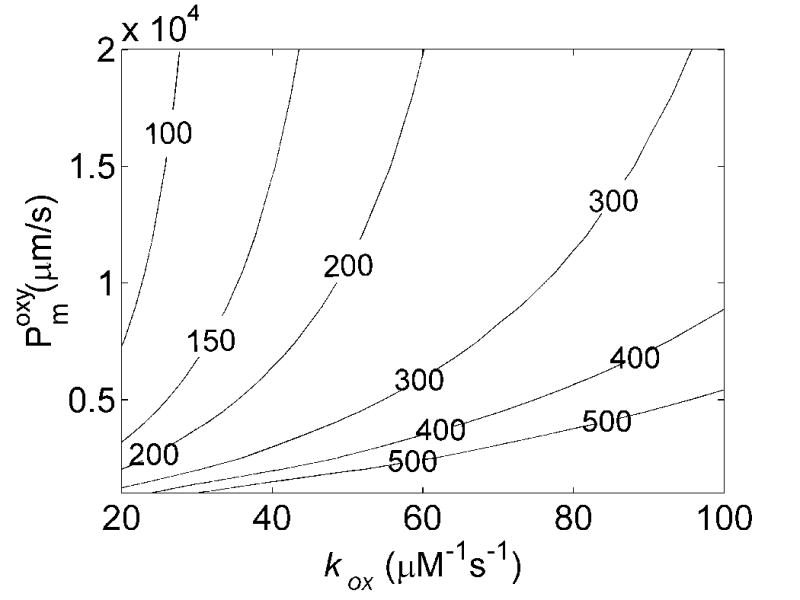
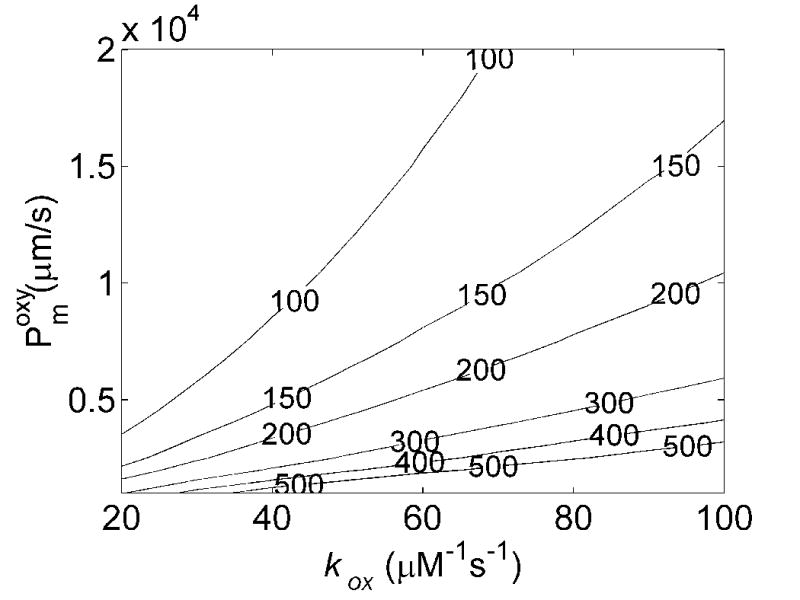
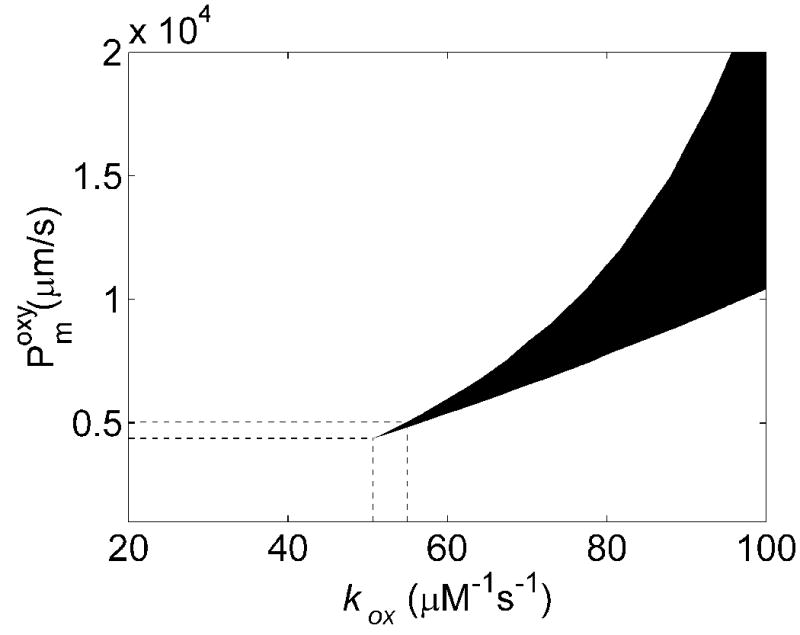
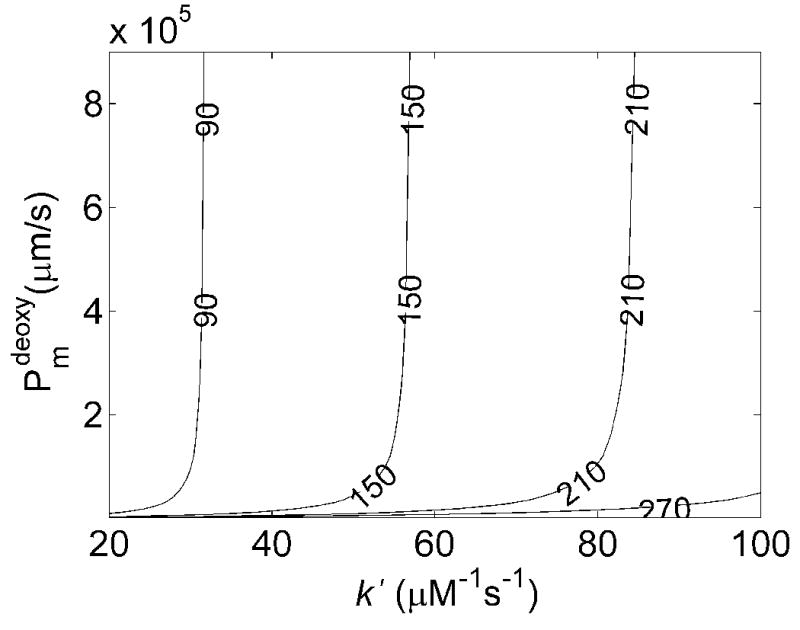
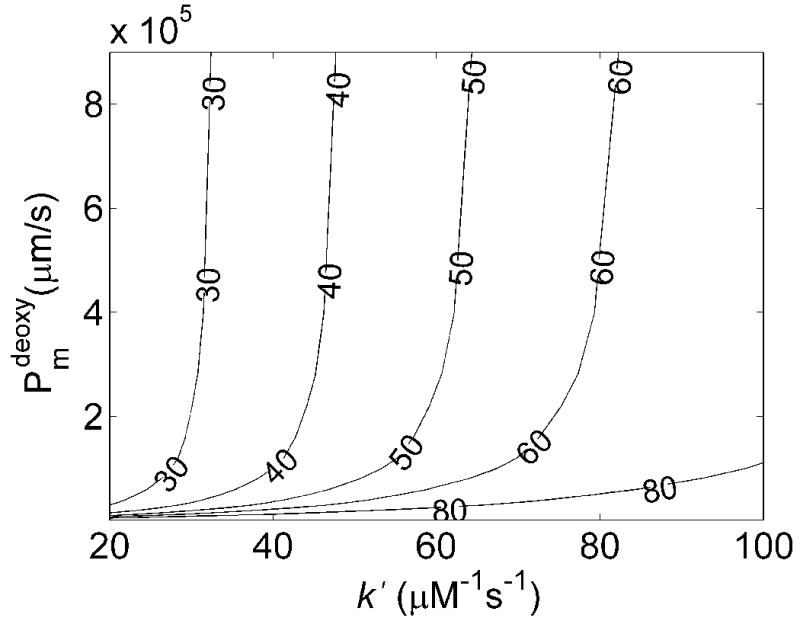
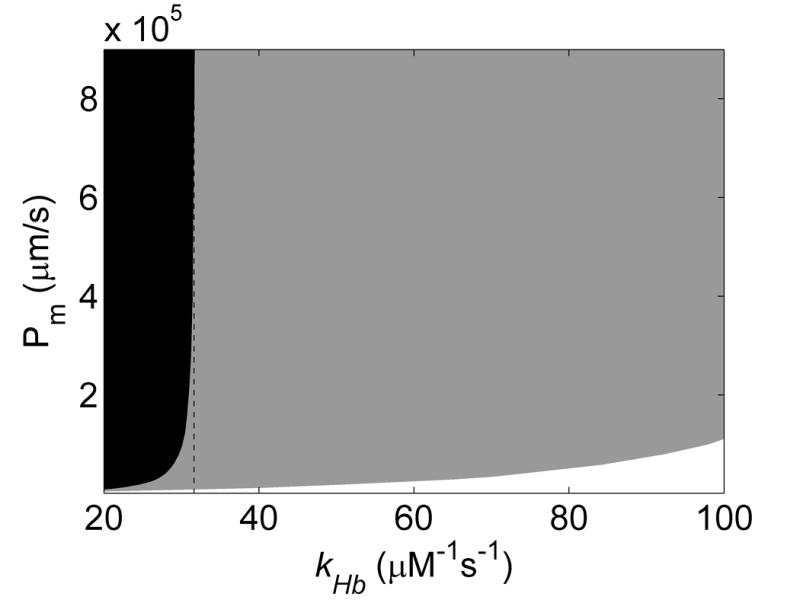
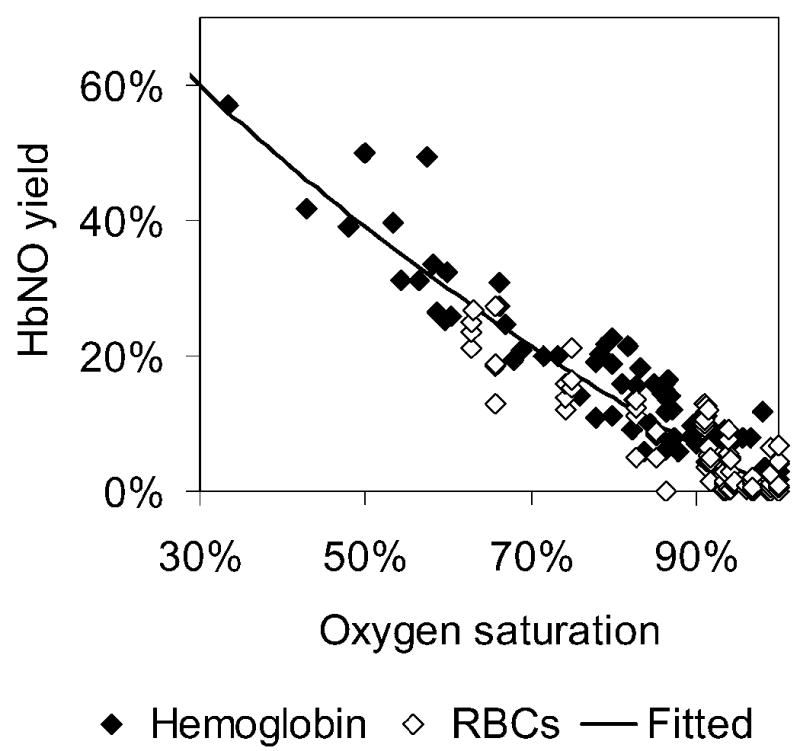
Red blood cell (RBC) encapsulated hemoglobin in the blood scavenges nitric oxide (NO) much more slowly than cell-free hemoglobin would. Part of this reduced NO scavenging has been attributed to an intrinsic membrane barrier to diffusion of NO through the RBC membrane. Published values for the permeability of RBCs to NO vary over several orders of magnitude. Recently, the rate that RBCs scavenge NO has been shown to depend on the hematocrit (percentage volume of RBCs) and oxygen tension. The difference in rate constants was hypothesized to be due to oxygen modulation of the RBC membrane permeability, but also could have been due to the difference in bimolecular rate constants for the reaction of NO and oxygenated vs deoxygenated hemoglobin. Here, we model NO scavenging by RBCs under previously published experimental conditions. A finite-element based computer program model is constrained by published values for the reaction rates of NO with oxygenated and deoxygenated hemoglobin as well as RBC NO scavenging rates. We find that the permeability of RBCs to NO under oxygenated conditions is between 4400 and 5100 microm s(-1) while the permeability under deoxygenated conditions is greater than 64,000 microm s(-1). The permeability changes by a factor of 10 or more upon oxygenation of anoxic RBCs. These results may have important implications with respect to NO import or export in physiology.


Figures

Figure 1
Figure 1
NO competition scenario with biconcave disk (15% HCT shown). To adjust hematocrit, the cylinder width and height are increased by the same distance. A top (A) and side (B) view are shown. Region 1 is the RBC and region 2 is the extracellular space. The NO donor is homogenously distributed in region 2 which also contains cell-free Hb.
Figure 1
Figure 1
NO competition scenario with biconcave disk (15% HCT shown). To adjust hematocrit, the cylinder width and height are increased by the same distance. A top (A) and side (B) view are shown. Region 1 is the RBC and region 2 is the extracellular space. The NO donor is homogenously distributed in region 2 which also contains cell-free Hb.
Figure 2
Figure 2
Construction of the biconcave disk model using third degree Bezier curves, with control points shown. A cell radius of 4 μm was chosen to reflect average physiological RBC width.
Figure 3
Figure 3
Effects of membrane NO permeability, Pmoxy, and bimolecular reaction rate, kox, on kf/kr. A) Contour plot of kf/kr vs the bimolecular reaction rate and RBC membrane permeability with 15% hematocrit, 20 μM cell-free Hb and B) 50% hematocrit, 200 μM cell-free Hb. The numbers on the contours correspond to the values of kf/kr. Concentrations of cell-free Hb were chosen to be representative of those used experimentally [19]. Small variations in the amount of cell free Hb used were found to have little effect on the calculated values of kf/kr, consistent with experimental results [12]. C) Allowable values of Pm and kox are shown. Incorporation of experimentally measured values of kf/kr (Table 1) constrain allowable calculated values of kf/kr from 3A and 3B giving the black shaded region. The minimum value of kox allowable is 50.6 μM−1s−1 and the minimum value for Pm is 4400 μm/s. Additional constraint is obtained incorporating the maximum value of the bimolecular rate of the reaction of deoxyHb and NO, k′, and r = kox/k′ (Figure 5). These provide upper limits for Pm and kox (shown with the lines extending from horizontal and vertical axes) given by kox = 55.0 μM−1s−1 and Pm = 5100 μm/s.
Figure 3
Figure 3
Effects of membrane NO permeability, Pmoxy, and bimolecular reaction rate, kox, on kf/kr. A) Contour plot of kf/kr vs the bimolecular reaction rate and RBC membrane permeability with 15% hematocrit, 20 μM cell-free Hb and B) 50% hematocrit, 200 μM cell-free Hb. The numbers on the contours correspond to the values of kf/kr. Concentrations of cell-free Hb were chosen to be representative of those used experimentally [19]. Small variations in the amount of cell free Hb used were found to have little effect on the calculated values of kf/kr, consistent with experimental results [12]. C) Allowable values of Pm and kox are shown. Incorporation of experimentally measured values of kf/kr (Table 1) constrain allowable calculated values of kf/kr from 3A and 3B giving the black shaded region. The minimum value of kox allowable is 50.6 μM−1s−1 and the minimum value for Pm is 4400 μm/s. Additional constraint is obtained incorporating the maximum value of the bimolecular rate of the reaction of deoxyHb and NO, k′, and r = kox/k′ (Figure 5). These provide upper limits for Pm and kox (shown with the lines extending from horizontal and vertical axes) given by kox = 55.0 μM−1s−1 and Pm = 5100 μm/s.
Figure 4
Figure 4
Effects of membrane NO permeability, Pmdeoxy, and bimolecular reaction rate, k′, on kf/kr. A) Contour plot of kf/kr vs the bimolecular reaction rate and RBC membrane permeability with 15% hematocrit, 20 μM cell-free Hb and B) 50% hematocrit, 200 μM cell-free Hb. C) Contour data from 15% (black) and 50% (gray) Hct were overlaid, showing allowed regions where Pmdeoxy and k′ satisfy experimental observations (black) for NO competition performed under deoxygenated conditions (Table 1). The maximum k′ is 31.6 μM−1s−1. The minimum value of Pmdeoxy of 64,000 μm/s is obtained at the lowest value of k′ allowable given the constraints on r and kox, Pmdeoxy = 29.1 μM−1s−1.
Figure 4
Figure 4
Effects of membrane NO permeability, Pmdeoxy, and bimolecular reaction rate, k′, on kf/kr. A) Contour plot of kf/kr vs the bimolecular reaction rate and RBC membrane permeability with 15% hematocrit, 20 μM cell-free Hb and B) 50% hematocrit, 200 μM cell-free Hb. C) Contour data from 15% (black) and 50% (gray) Hct were overlaid, showing allowed regions where Pmdeoxy and k′ satisfy experimental observations (black) for NO competition performed under deoxygenated conditions (Table 1). The maximum k′ is 31.6 μM−1s−1. The minimum value of Pmdeoxy of 64,000 μm/s is obtained at the lowest value of k′ allowable given the constraints on r and kox, Pmdeoxy = 29.1 μM−1s−1.
Figure 5
Figure 5
HbNO yield at different Hb oxygen saturations. Data are shown for Hb and RBCs. Most of the data shown were published previously [27] where NO was added using buffer but some additional data on Hb were collected for this figure using an NO donor ProliNO. The solid line represent the best fit of Eq. 6 to the data and corresponds to a value of r = 1.56. A 95% confidence level gives r = 1.56 ± 0.18.

References

    1. Furchgott RF, Zawadzki JV. The Obligatory Role of Endothelial-Cells in the Relaxation of Arterial Smooth-Muscle by Acetylcholine. Nature. 1980;288:373–376. - PubMed
    1. Ignarro LJ, Byrns RE, Buga GM, Wood KS. Endothelium-Derived Relaxing Factor from Pulmonary-Artery and Vein Possesses Pharmacological and Chemical-Properties Identical to Those of Nitric-Oxide Radical. Circ Res. 1987;61:866–879. - PubMed
    1. Katsuki S, Arnold W, Mittal C, Murad F. Stimulation of Guanylate Cyclase by Sodium Nitroprusside, Nitroglycerin and Nitric-Oxide in Various Tissue Preparations and Comparison to Effects of Sodium Azide and Hydroxylamine. J Cyclic Nucleotide Res. 1977;3:23–35. - PubMed
    1. Palmer RMJ, Ferrige AG, Moncada S. Nitric-Oxide Release Accounts for the Biological-Activity of Endothelium-Derived Relaxing Factor. Nature. 1987;327:524–526. - PubMed
    1. Ignarro LJ. Nitric Oxide Biology and Pathobiology. Academic press; San Diego: 2000.

Publication types

MeSH terms

LinkOut - more resources