

Human growth hormone (GH1) gene polymorphism map in a normal-statured adult population
- PMID: 17223997
- PMCID: PMC1859974
- DOI: 10.1111/j.1365-2265.2006.02718.x
Human growth hormone (GH1) gene polymorphism map in a normal-statured adult population
Abstract
Objective: GH1 gene presents a complex map of single nucleotide polymorphisms (SNPs) in the entire promoter, coding and noncoding regions. The aim of the study was to establish the complete map of GH1 gene SNPs in our control normal population and to analyse its association with adult height.
Design, subjects and measurements: A systematic GH1 gene analysis was designed in a control population of 307 adults of both sexes with height normally distributed within normal range for the same population: -2 standard deviation scores (SDS) to +2 SDS. An analysis was performed on individual and combined genotype associations with adult height.
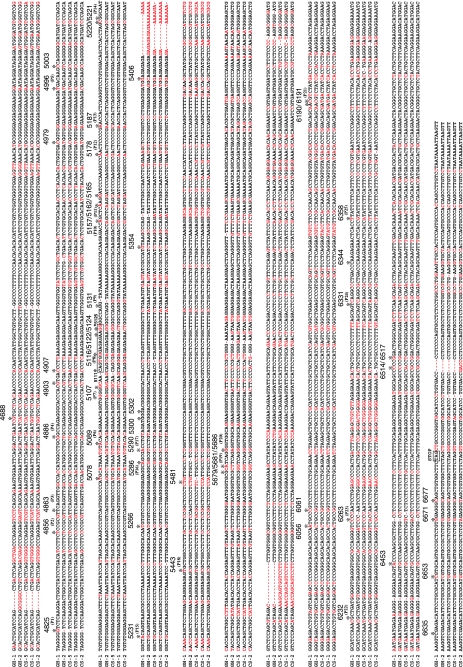
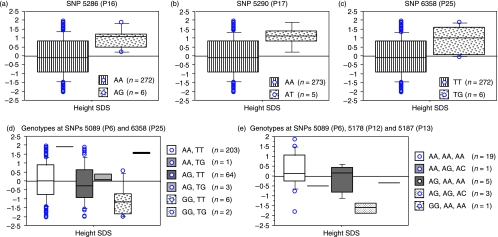
Results: Twenty-five SNPs presented a frequency over 1%: 11 in the promoter (P1 to P11), three in the 5'UTR region (P12 to P14), one in exon 1 (P15), three in intron 1 (P16 to P18), two in intron 2 (P19 and P20), two in exon 4 (P21 and P22) and three in intron 4 (P23 to P25). Twenty-nine additional changes with frequencies under 1% were found in 29 subjects. P8, P19, P20 and P25 had not been previously described. P6, P12, P17 and P25 accounted for 6.2% of the variation in adult height (P = 0.0007) in this population with genotypes A/G at P6, G/G at P6 and A/G at P12 decreasing height SDS (-0.063 +/- 0.031, -0.693 +/- 0.350 and -0.489 +/- 0.265, Mean +/- SE) and genotypes A/T at P17 and T/G at P25 increasing height SDS (+1.094 +/- 0.456 and +1.184 +/- 0.432).
Conclusions: This study established the GH1 gene sequence variation map in a normal adult height control population confirming the high density of SNPs in a relatively small gene. Our study shows that the more frequent SNPs did not significantly contribute to height determination, while only one promoter and two intronic SNPs contributed significantly to it. Studies in larger populations will have to confirm the associations and in vitro functional studies will elucidate the mechanisms involved. Systematic GH1 gene analysis in patients with growth delay and suspected GH deficiency/insufficiency will clarify whether different SNP frequencies and/or the presence of different sequence changes may be associated with phenotypes in them.
Figures
References
-
- Chatterjee S, Das N, Chatterjee P. The estimation of the heritability of anthropometric measurements. Applied Human Science. 1999;18:1–7. - PubMed
-
- Hirschhorn JN, Lindgren CM, Daly MJ, Kirby A, Schaffner SF, Burtt NP, Altshuler D, Parker A, Rioux JD, Platko J, Gaudet D, Hudson TJ, Groop LC, Lander ES. Genomewide linkage analysis of stature in multiple populations reveals several regions with evidence of linkage to height. American Journal of Human Genetics. 2001;69:106–116. - PMC - PubMed
-
- Mullis PE. Genetic control of growth. European Journal of Endocrinology. 2005;152:11–31. - PubMed
-
- Audi L, Granada ML, Carrascosa A. Growth hormone secretion assessment in the diagnosis of short stature. Journal of Pediatric Endocrinology and Metabolism. 1996;9:313–324. - PubMed
-
- Audi L, Llopis MA, Granada ML, Hermoso F, Del Valle J, Rodriguez-Arnao MD, Bel J, Luzuriaga C, Gallego E, Marin F Grupo Español de Estudio de la Talla Baja. Low sensitivity of IGF-I, IGFBP-3 and urinary GH in the diagnosis of growth hormone insufficiency in slowly-growing short-statured boys. Medicina Clinica. 2001;116:6–11. - PubMed
Publication types
MeSH terms
Substances
LinkOut - more resources
Full Text Sources
Research Materials
Miscellaneous
