. 2007 Mar;35(1):140-8.
doi: 10.1016/j.neuroimage.2006.11.009. Epub 2007 Jan 16.

Cortical abnormalities in epilepsy revealed by local EEG synchrony

Affiliations

Cortical abnormalities in epilepsy revealed by local EEG synchrony

C A Schevon et al. Neuroimage. 2007 Mar.

Abstract

Abnormally strong functional linkage between cortical areas has been postulated to play a role in the pathogenesis of partial epilepsy. We explore the possibility that such linkages may be manifest in the interictal EEG apart from epileptiform disturbances or visually evident focal abnormalities. We analyzed samples of interictal intracranial EEG (ICEEG) recorded from subdural grids in nine patients with medically intractable partial epilepsy, measuring interelectrode synchrony using the mean phase coherence algorithm. This analysis revealed areas of elevated local synchrony, or "hypersynchrony" which had persistent spatiotemporal characteristics that were unique to each patient. Measuring local synchrony in a subdural grid results in a map of the cortical surface that provides information not visually apparent on either EEG or structural imaging. We explore the relationship of hypersynchronous areas to the clinical evidence of seizure localization in each case, and speculate that local hypersynchrony may be a marker of epileptogenic cortex, and may prove to be a valuable aid to clinical ICEEG interpretation.


Figures

Figure 1
Figure 1
Histogram of MPC values and probability density functions showing the bimodal Gaussian distribution of non-LH (solid density curve, left) and LH (dotted curve, right) electrode pairs. Probability density curves were calculated from the mean and standard deviations of the MPC values in the two groups of electrode pairs. The linear discriminator dividing the two groups is shown as a dashed vertical line. These data are from Patient 3’s subdural grid.
Figure 2
Figure 2
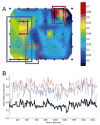
Patient 1, with nonlesional neocortical epilepsy and an 8×5 subdural grid placed over the right posterior temporal/central region. Grid location was determined by visual observation at time of implantation and confirmed by postoperative radiograph. a) Surface map of the 8×5 subdural grid depicting 5-minute averaged MPC measures for orthogonally adjacent grid channels. The MPC measure is depicted by a red-blue color map; a sidebar shows the color mapping for each plot. Two major noncontiguous LH regions are present, shown bounded by blue and red rectangles, located in the posterior temporal/occipital region and suprasylvian frontal regions. The clinically determined seizure onset zone is shown for comparison (magenta rectangle). Electrode pairs meeting criteria for local hypersynchrony are marked by connecting black lines. b) Local synchrony, computed over 2 second epochs for a continuous 38 minute interictal recording. The average MPC for the sets of LH channel pairs in each region are averaged and plotted in blue (posterior temporal region) and red (suprasylvian frontal region). Compare with the averaged MPC for all channel pairs (heavy black). Note that the relative values of the LH regions remain persistently high compared to the average.
Figure 3
Figure 3
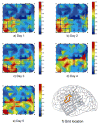
a–e) Daily snapshots of Patient 2’s 8×8 subdural grid, showing day to day variations in local synchrony and identification of LH channel pairs. The location of the grid on the cortical surface is shown in f), with electrode 1 corresponding to the top left corner of the grid maps and electrode 8 to the top right corner. Snapshots were selected from 125 time samples taken over a 5 day monitoring period. Two LH regions are seen, one in the anterior/inferior portion of the grid (frontal and temporal perisylvian region) and one more posteriorly in the parietal lobe. Day to day variations primarily occur at the boundaries of the LH regions, while the core areas are consistently identified as LH in each day’s recording; note that at one point the two regions appear to merge. The boundaries of the presumed epileptogenic zone and resection target area in the grid are indicated with the red tracing in f), while the locally hypersynchronous regions are shown traced in gray.
Figure 4
Figure 4
Spatial variation in local 5-minute average MPC in Patient 3, a 9 year old with Parry-Romberg syndrome and a left peri-insular lesion in prolonged focal status epilepticus. a) Marked local hypersynchrony in the inferior frontal region as compared to the lateral temporal region. The frontal and temporal resections are shown in red outline. b) T2-weighted image showing the perisylvian lesion. c) Intracranial EEG showing typical ictal activity broadly distributed across the left fronto-temporal grid. Compared to the synchrony map, the differences between the frontal and temporal regions are difficult to appreciate on visual inspection.
Figure 5
Figure 5
Local synchrony patterns and clinically identified epileptogenic zones (red boxes) in subdural grid recordings of Patients 4 – 9. The grid maps are as described in Figures 2 and 3. a) Local hypersynchrony over well-defined structural lesions (Patients 4 and 5). The lesions are indicated by the hatched outlined areas. b) LH regions in the anterior temporal region (Patient 6) and parietal lobes (Patients 6 and 7). The red boxed area in Patient 6 was included in the resection, while no neocortical areas were resected in Patient 7. c) LH regions in nonlesional frontal lobe epilepsy (Patients 8 and 9). Note the relative locations of the LH regions and epileptogenic zones in Patient 8. Patient 9’s LH regions indicated a surprising degree of focality given the widespread activity on the EEG. Based on the EEG findings, Patient 9 underwent two resections: lateral temporal lobe anterior to a language-critical area found on neurostimulation mapping, and a near-complete functional frontal lobectomy sparing primary motor and Broca’s area. The language-critical areas are shown traced in yellow.
Figure 5
Figure 5
Local synchrony patterns and clinically identified epileptogenic zones (red boxes) in subdural grid recordings of Patients 4 – 9. The grid maps are as described in Figures 2 and 3. a) Local hypersynchrony over well-defined structural lesions (Patients 4 and 5). The lesions are indicated by the hatched outlined areas. b) LH regions in the anterior temporal region (Patient 6) and parietal lobes (Patients 6 and 7). The red boxed area in Patient 6 was included in the resection, while no neocortical areas were resected in Patient 7. c) LH regions in nonlesional frontal lobe epilepsy (Patients 8 and 9). Note the relative locations of the LH regions and epileptogenic zones in Patient 8. Patient 9’s LH regions indicated a surprising degree of focality given the widespread activity on the EEG. Based on the EEG findings, Patient 9 underwent two resections: lateral temporal lobe anterior to a language-critical area found on neurostimulation mapping, and a near-complete functional frontal lobectomy sparing primary motor and Broca’s area. The language-critical areas are shown traced in yellow.
Figure 6
Figure 6
Plots of the 5-minute average MPC vs. interelectrode distance for Patient 1. Solid dots denote channel pairs for which both electrodes were outside of LH areas. Squares denote electrode pairs belonging to a single LH region, while crosses denote electrode pairs located in noncontiguous LH regions. Note that local synchrony values are represented by the data at x = 1. The data show that LH electrode pairs nearly always had higher synchrony values than non-LH pairs regardless of the distance between them; the synchrony between the two LH regions (shown in Figure 2) is especially prominent.

Similar articles

Cited by

References

    1. Alarcon G, Binnie CD, et al. Power spectrum and intracranial EEG patterns at seizure onset in partial epilepsy. Electroencephalogr Clin Neurophysiol. 1995;94:326–337. - PubMed
    1. Allen PJ, Fish DR, et al. Very high-frequency rhythmic activity during SEEG suppression in frontal lobe epilepsy. Electroencephalography and Clinical Neurophysiology. 1992;82(2):155–59. - PubMed
    1. Asano E, Muzik O, et al. Quantitative visualization of ictal subdural EEG changes in children with neocortical focal seizures. Clinical Neurophysiology. 2004;115(12):2718–27. - PMC - PubMed
    1. Blumenfeld H. Positive and negative network correlations in temporal lobe epilepsy - PubMed
    1. Bragin A, Wilson CL, et al. Chronic epileptogenesis requires development of a network of pathologically interconnected neuron clusters: a hypothesis. Epilepsia. 2000;41(Suppl 6):S144–52. - PubMed

Publication types