. 2007 Mar;63(5):591-608.
doi: 10.1007/s11103-006-9111-1. Epub 2007 Jan 16.

Global genome expression analysis of rice in response to drought and high-salinity stresses in shoot, flag leaf, and panicle

Affiliations

Global genome expression analysis of rice in response to drought and high-salinity stresses in shoot, flag leaf, and panicle

Junli Zhou et al. Plant Mol Biol. 2007 Mar.

Abstract

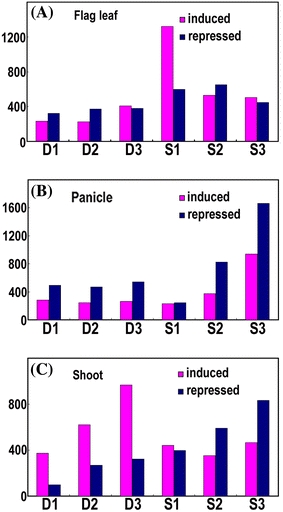
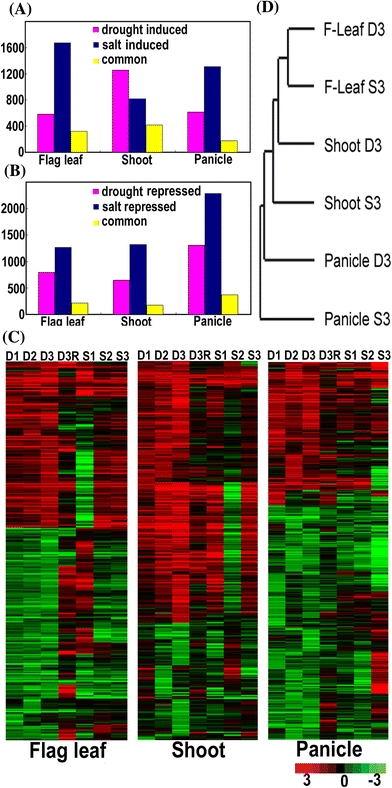
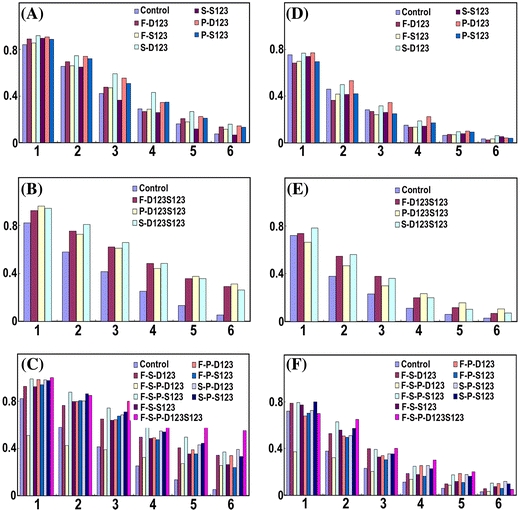
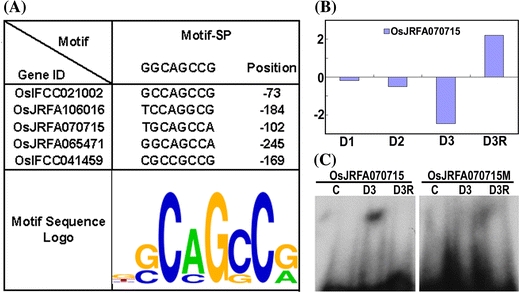
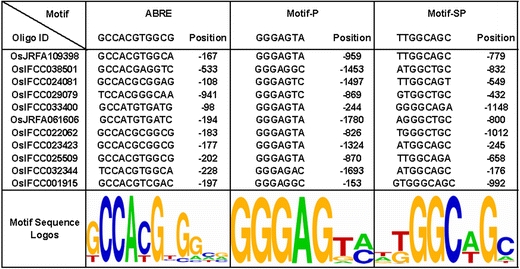
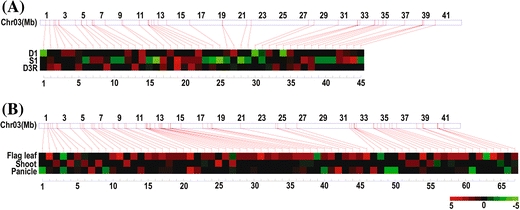
To elucidate genome-level responses to drought and high-salinity stress in rice, a 70 mer oligomer microarray covering 36,926 unique genes or gene models was used to profile genome expression changes in rice shoot, flag leaf and panicle under drought or high-salinity conditions. While patterns of gene expression in response to drought or high-salinity stress within a particular organ type showed significant overlap, comparison of expression profiles among different organs showed largely organ-specific patterns of regulation. Moreover, both stresses appear to alter the expression patterns of a significant number of genes involved in transcription and cell signaling in a largely organ-specific manner. The promoter regions of genes induced by both stresses or induced by one stress in more than one organ types possess relative enrichment of two cis-elements (ABRE core and DRE core) known to be associated with water stress. An initial computational analysis indicated that novel promoter motifs are present in the promoters of genes involved in rehydration after drought. This analysis suggested that rice might possess a mechanism that actively detects rehydration and facilitates rapid recovery. Overall, our data supports a notion that organ-specific gene regulation in response to the two abiotic stresses may primarily be mediated by organ-specific transcription responses.


Figures

Fig. 1
Fig. 1
The number of differentially expressed genes at each stage of drought and high-salinity treatments in three organs. Differentially expressed genes (both induced or repressed) are defined as those with P < 0.05. D1, D2 and D3: three stages of drought stress, S1, S2, and S3: three stages of high-salinity stress. y-axis shows the gene number. (A) Number of genes induced or repressed in flag leaf. (B) Number of genes induced or repressed in panicle. (C) Number of genes induced or repressed in shoot.
Fig. 2
Fig. 2
Comparison of drought and high-salinity genome expression responses in the three rice organs. (A) Total number of drought and high-salinity stress inducible genes and the number of genes induced in response to both stresses in each of the three rice organs. Genes induced at least at one stage under drought or high-salinity treatments are included in the analysis. y-axis shows the gene number. (B) The total number of drought and high-salinity stress repressed genes and the number of genes repressed in response to both stresses in each of the three rice organs. Genes repressed at least at one stage under drought or high-salinity treatments are included in the analysis. y-axis shows the gene number. (C) Clustering analysis of all drought and high salinity responsive genes in each of the three rice organs. The differentially expressed genes (both induced or repressed) with P < 0.05 at least at one stage of drought treatment are included. The median ratio (treated/untreated sample) is log2 transformed and subject to complete linkage hierarchical clustering. D1, D2, and D3: three stages of drought treatment; D3R: 48-h water recovery after drought; S1, S2, and S3: three stages of high-salinity treatment. In total, 1,377, 1,903, and 1,919 genes from flag leaf, shoot, and panicle, respectively, were included in this analysis. (D) Relatedness of the genome expression patterns across selected stress-treated rice organs. A complete-linkage hierarchical clustering analysis of overall relatedness for expression ratios from selected organs at the stage 3 of both abiotic stress treatments. The abbreviations for different sample types are the same as in panel C
Fig. 3
Fig. 3
Cluster analysis of genes exhibiting elevated expression after 48-h rehydration following drought. (A) (B) and (C) Cluster analysis of the genes exhibiting significant elevation of expression (with P < 0.05 as threshold) after 48 h of rehydration treatment for flag leaf, shoot, and panicle. The median ratio is log2 transformed and subject to complete linkage hierarchical clustering. A total of 807 genes in flag leaf (A), 281 genes in shoot (B), and 224 genes in panicle (C) are included in this analysis. D1, D2, and D3 represent three stages of drought treatment, and D3R represents 48-h rehydration of the D3 stage. (D) The histogram shows the number of genes in each of the three rice organs induced under drought treatment at least at one drought stage, after 48-h rehydration following the D3 stage, and the number of genes with overlapping expression in various pairs of organs. y-axis shows the gene number
Fig. 4
Fig. 4
Comparison of gene expression patterns among the three rice organs in response to drought and high-salinity stresses. (A) and (B): Venn diagram of drought (A) and high-salinity (B) induced genes among the three rice organs. (C) and (D): Venn diagram of drought (C) and high-salinity (D) repressed genes among the three rice organs
Fig. 5
Fig. 5
RT-PCR analysis of the representative drought-induced genes among the three rice organs. Total RNA samples were prepared from the shoot (S1, S2, and S3), flag leaf (F1, F2, and F3), and panicle (P1, P2, and P3) and taken from plants at three stages of drought treatment and the untreated control plants (S0, F0, and P0). The corresponding log2 transformed median ratio of microarray data is shown at the bottom of each mRNA blot line. N/A: no expression. The * corresponds to cases where the microarray data was not confirmed by the mRNA blot results
Fig. 6
Fig. 6
Distribution of the ABRE and DRE core motif sequences among different groups of drought and high-salinity stress responsive genes. In all panels, the x-axis shows the copy number of ABRE or DRE core motifs and the y-axis shows the relative number of genes containing different copy numbers of ABRE or DRE core motifs.(A) ABRE core motif distribution among promoters of the genes induced only by drought or only by high-salinity stress in each single rice organ. (B) ABRE core motif distribution among promoters of genes induced by both drought and high-salinity stress in each rice organ. (C) ABRE core motif distribution among promoters of genes induced in two or three organs. (D) DRE core motif distribution among promoters of genes induced only by drought or only by high-salinity stress in each rice organ. (E) DRE core motif distribution among promoters of genes induced by both drought and high-salinity stress in each rice organ. (F) DRE core motif distribution among promoters of genes induced in two or three organs or by both stresses in more than one organ. The following 18 gene groups (with number of genes with full-length cDNA gene number) were analyzed. (1) Genes induced by drought stress only in flag leaf (F-D123, 82). (2) Genes induced by high-salinity stress only in flag leaf (F-S123, 433). (3) Genes induced by drought stress only in shoot (S-D123, 272). (4) Genes induced by high-salinity stress only in shoot (S-S123, 77). (5) Genes induced by drought stress only in panicle (P-D123, 139). (6) Genes induced by high-salinity stress only in panicle (P-S123, 420). (7) Genes induced by both stresses in flag leaf (F-D123S123, 190). (8) Genes induced by both stresses in shoot (S-D123S123, 252). (9) Genes induced by both stresses in panicle (P-D123S123, 77). (10) Genes induced by drought stress in both flag leaf and shoot (F-S-D123, 123). (11) Genes induced by drought stress in all three organs (F-S-P-D123, 59). (12) Genes induced by high-salinity stress in all three organs (F-S-P-S123, 97). (13) Genes induced by high-salinity stress in both flag leaf and shoot (F-S-S123, 309). (14) Genes induced by drought stress in both flag leaf and panicle (F-P-D123, 59). (15) Genes induced by high-salinity stress in both flag leaf and panicle (F-P-S123, 184). (16) Genes induced by drought stress in both shoot and panicle (S-P-D123, 51). (17) Genes induced by high-salinity stress in both shoot and panicle (S-P-S123, 124). (18) Genes induced by both stresses in all three organs (F-S-P-D123S123, 20)
Fig. 7
Fig. 7
A novel promoter motif associated with genes repressed by drought but induced after rehydration in rice shoot. (A) The core sequence of the motif and the position of the motif in each promoter. (B) The expression pattern of a representative gene containing motif-SP. The histogram shows the log2 transformed ratio at three drought stress stages (D1, D2, D3) and 48-hour rehydration (D3R). (C) Gel shift assay of motif-SP. Nuclear proteins were extracted from shoots of untreated plants (C), plants at stage 3 of drought treatment (D3), and plants after 48-h rehydration following stage 3 (D3R). Core sequences of the probe OsJRFA070715: TGCAGCCA, and core sequence of the probe with a single base point mutation OsJRFA070715M: TGAAGCCA
Fig. 8
Fig. 8
Three motifs associated with genes repressed during drought and induced by rehydration in panicle. The core sequence logos and the position of the motifs in each of the 11 promoters are listed
Fig. 9
Fig. 9
Distribution of drought, high salinity and rehydration regulated genes in a representative rice chromosome. (A) Map of chromosome 3 genes differentially expressed at the first stage of drought, first stage of high-salinity stress, and 48 h after rehydration in shoot. (B) Map of chromosome 3 genes differentially expressed at 48 h after rehydration in the three rice organs

References

    1. None
    2. Barr HD, Weatherley PE (1962) A re-examination of the relative turgidity technique for estimating water deficit in leaves. Aust J Biol Sci 15:413–428
    1. {'text': '', 'ref_index': 1, 'ids': [{'type': 'DOI', 'value': '10.1016/S0014-5793(03)01118-9', 'is_inner': False, 'url': 'https://doi.org/10.1016/s0014-5793(03)01118-9'}, {'type': 'PubMed', 'value': '14596925', 'is_inner': True, 'url': 'https://pubmed.ncbi.nlm.nih.gov/14596925/'}]}
    2. Becker D, Hoth S, Ache P, Wenkel S, Roelfsema MR, Meyerhoff O, Hartung W, Hedrich R (2003) Regulation of the ABA-sensitive Arabidopsis potassium channel gene GORK in response to water stress. FEBS Lett 554:119–126 - PubMed
    1. {'text': '', 'ref_index': 1, 'ids': [{'type': 'DOI', 'value': '10.2307/1165312', 'is_inner': False, 'url': 'https://doi.org/10.2307/1165312'}]}
    2. Benjamini Y, Hochberg Y (2000) The adaptive control of the false discovery rate in multiple hypotheses testing. J Behav Educ Statist 25:60–83
    1. {'text': '', 'ref_index': 1, 'ids': [{'type': 'DOI', 'value': '10.1126/science.1090022', 'is_inner': False, 'url': 'https://doi.org/10.1126/science.1090022'}, {'type': 'PubMed', 'value': '14671301', 'is_inner': True, 'url': 'https://pubmed.ncbi.nlm.nih.gov/14671301/'}]}
    2. Birnbaum K, Shasha DE, Wang JY, Jung JW, Lambert GM, Galbraith DW, Benfey PN (2003) A gene expression map of the Arabidopsis root. Science 302:1956–1960 - PubMed
    1. {'text': '', 'ref_index': 1, 'ids': [{'type': 'DOI', 'value': '10.1126/science.1056794', 'is_inner': False, 'url': 'https://doi.org/10.1126/science.1056794'}, {'type': 'PubMed', 'value': '11181992', 'is_inner': True, 'url': 'https://pubmed.ncbi.nlm.nih.gov/11181992/'}]}
    2. Caron H, van Schaik B, van der Mee M, Baas F, Riggins G, van Sluis P, Hermus M, van Asperen R, Boon K, Voûte PA et al (2001) The human transcriptome map: clustering of highly expressed genes in chromosomal domains. Science 291:1289–1292 - PubMed

Publication types