. 2007 Jan;100(1):118-31.
doi: 10.1111/j.1471-4159.2006.04195.x.

Differential roles of Rap1 and Rap2 small GTPases in neurite retraction and synapse elimination in hippocampal spiny neurons

Affiliations

Differential roles of Rap1 and Rap2 small GTPases in neurite retraction and synapse elimination in hippocampal spiny neurons

Zhanyan Fu et al. J Neurochem. 2007 Jan.

Abstract

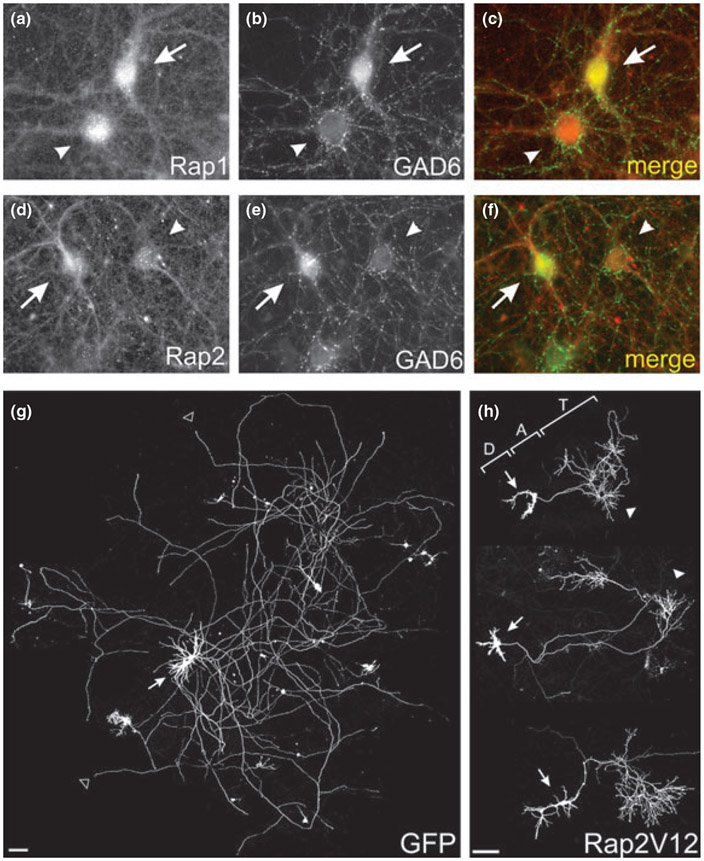
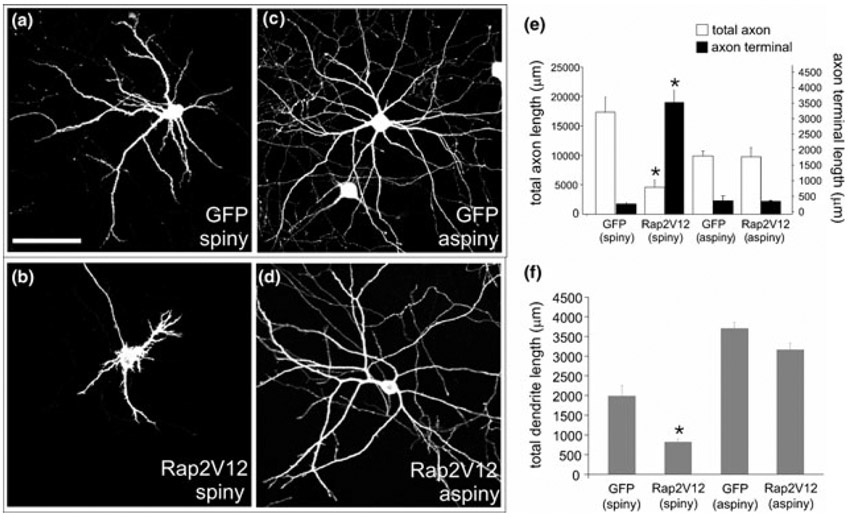
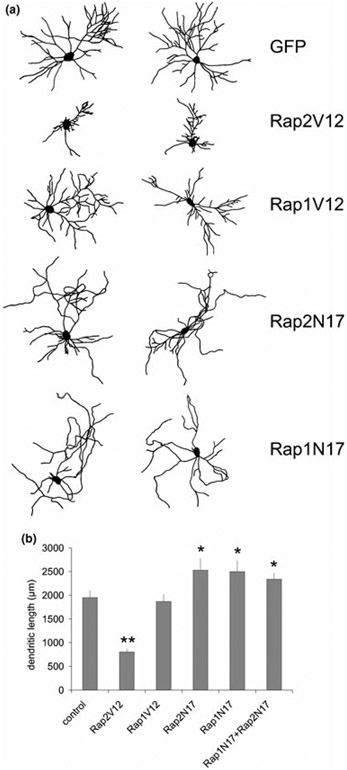
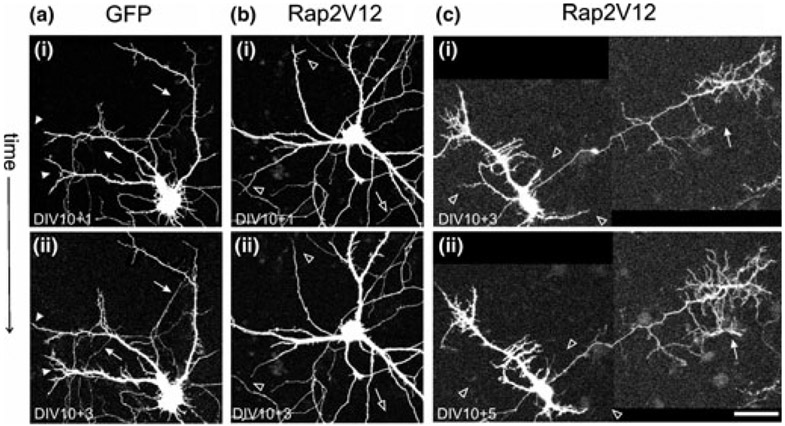
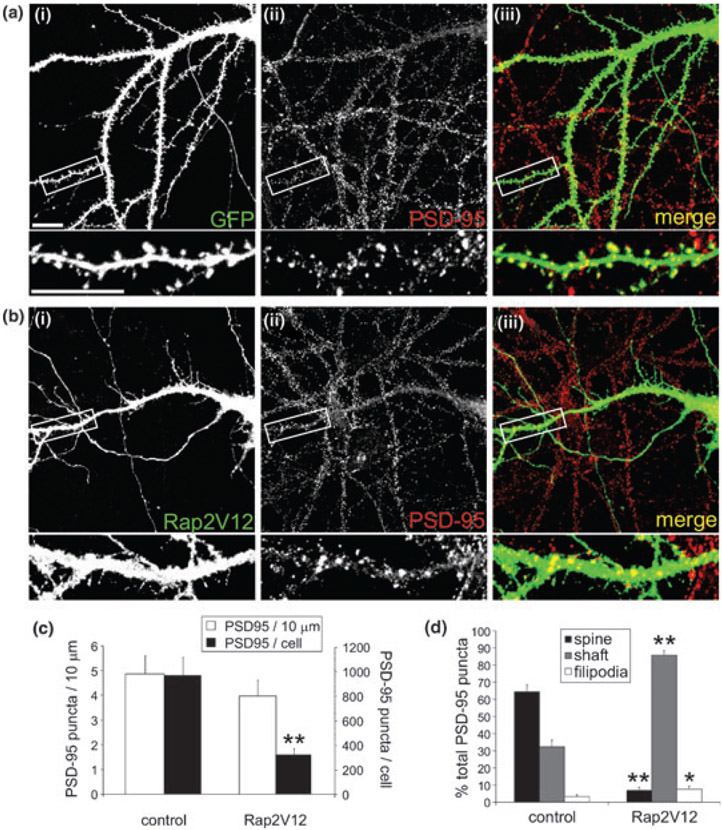
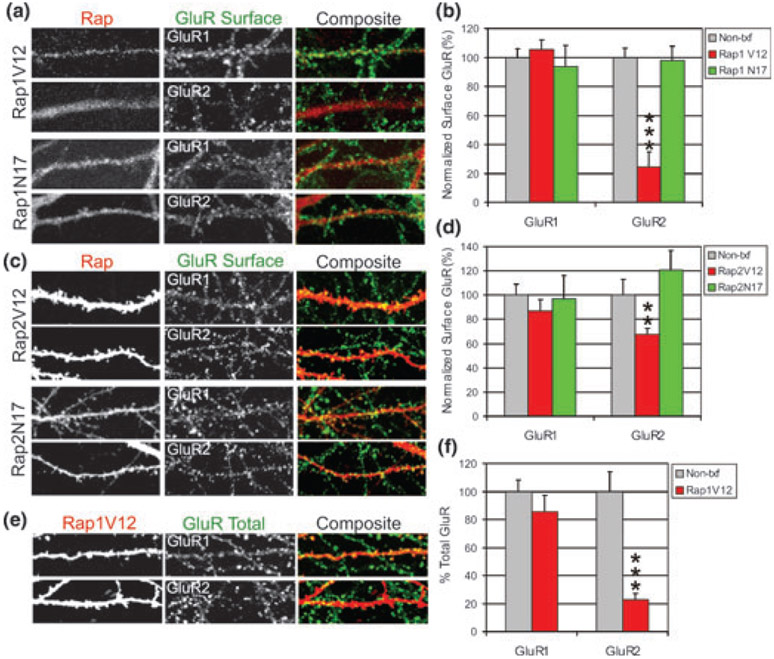
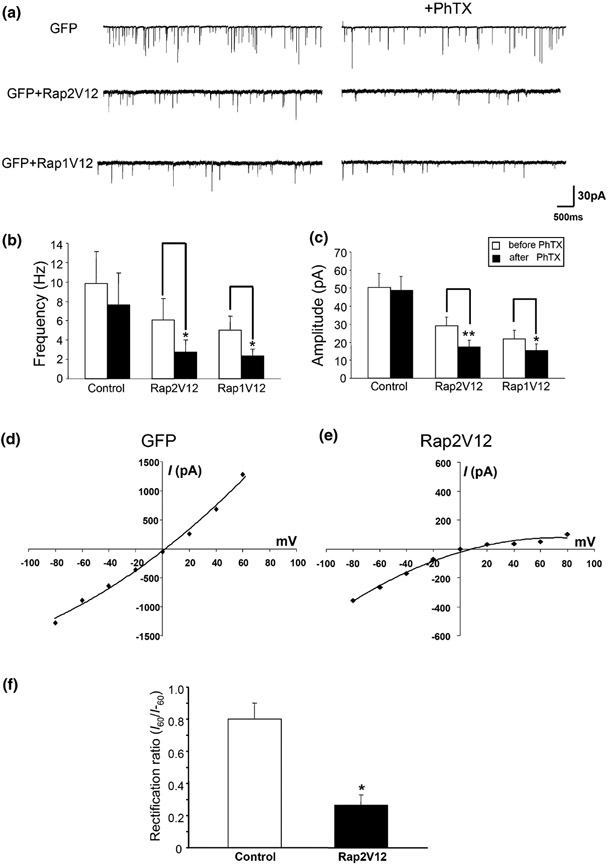
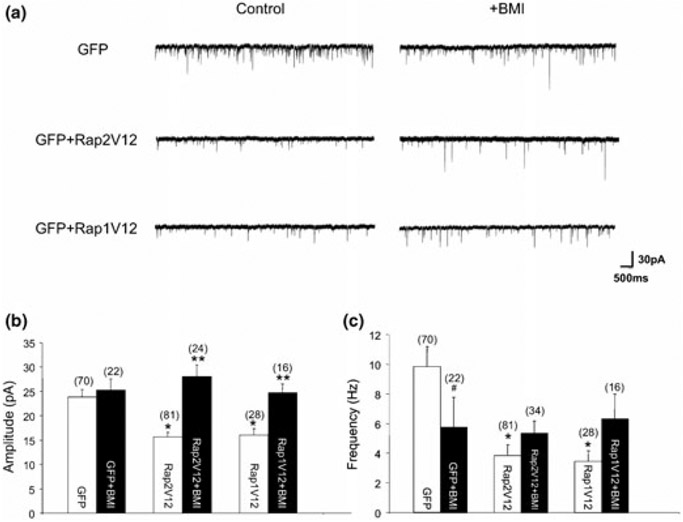
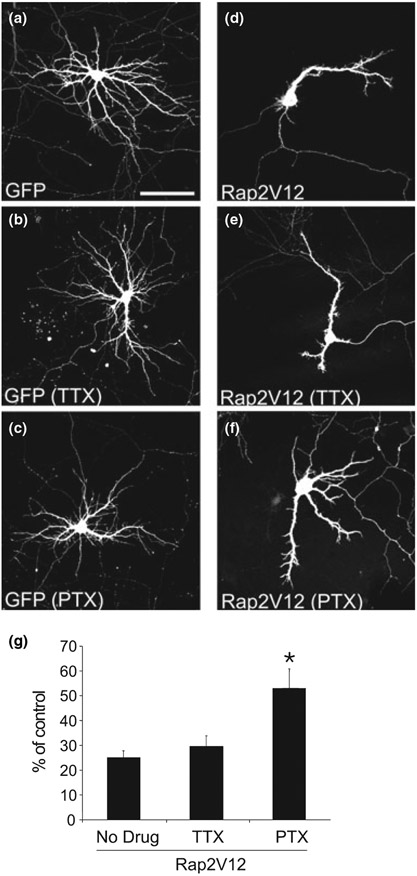
The Rap family of small GTPases is implicated in the mechanisms of synaptic plasticity, particularly synaptic depression. Here we studied the role of Rap in neuronal morphogenesis and synaptic transmission in cultured neurons. Constitutively active Rap2 expressed in hippocampal pyramidal neurons caused decreased length and complexity of both axonal and dendritic branches. In addition, Rap2 caused loss of dendritic spines and spiny synapses, and an increase in filopodia-like protrusions and shaft synapses. These Rap2 morphological effects were absent in aspiny interneurons. In contrast, constitutively active Rap1 had no significant effect on axon or dendrite morphology. Dominant-negative Rap mutants increased dendrite length, indicating that endogenous Rap restrains dendritic outgrowth. The amplitude and frequency of alpha-amino-3-hydroxy-5-methylisoxazole-4-propionate (AMPA)-mediated miniature excitatory postsynaptic currents (mEPSCs) decreased in hippocampal neurons transfected with active Rap1 or Rap2, associated with reduced surface and total levels of AMPA receptor subunit GluR2. Finally, increasing synaptic activity with GABA(A) receptor antagonists counteracted Rap2's inhibitory effect on dendrite growth, and masked the effects of Rap1 and Rap2 on AMPA-mediated mEPSCs. Rap1 and Rap2 thus have overlapping but distinct actions that potentially link the inhibition of synaptic transmission with the retraction of axons and dendrites.


Figures

Fig. 1
Fig. 1
Rap1 and Rap2 are expressed in both spiny and aspiny neurons in cultured hippocampal neurons at 10–15DIV. Neurons were immunostained for Rap1 (a) or Rap2 (d) and co-stained for GAD, a marker for aspiny GABAergic interneurons (b, e). GABAergic neurons had soma filled with bright GAD staining owing to the synthesis of this GABA precursor within the cell body (arrows), as opposed to spiny pyramidal neurons that had only GAD puncta decorating the somatic periphery and dendrites owing to presynaptic contact coming from GABAergic interneurons (arrowheads). Merged images are presented in (c) and (f). (g, h) Constitutively active Rap2 reduces dendrite and axon length and stimulates axon terminal sprouting. Cultured hippocampal neurons were transfected at 10DIV with expression plasmids encoding GFP (g) or Rap2V12 (h), and their morphologies visualized at 14–15DIV by immunostaining for GFP or Rap2V12. Three examples of Rap2V12-transfected neurons are shown in (h). Somatodendritic regions are indicated by arrows. Normal axon tips in (g) are indicated by open arrowheads. Tufted axon terminals in (h) are indicated by solid arrowheads. D, dendritic arbor; A, axon; T, axon terminal. Scale bar 100 μm.
Fig. 2
Fig. 2
Cell-type specificity of Rap2 effects on neuronal morphology. (a–d) Hippocampal neurons were transfected with GFP (a, c) or Rap2V12 (b, d) and visualized as in Fig. 1. Spiny neurons, but not aspiny neurons (which lack any dendritic protrusion), showed dendritic shortening by Rap2V12. Scale bar 100 μm. (e, f) Quantitation of total axon length (e, white bars), length of axon in terminal tufts (e, black bars; see methods), and total dendritic length (f) in spiny versus aspiny neurons, transfected with GFP or Rap2V12 as indicated. Data shown as mean ± SEM. *p < 0.001 versus GFP control (Student’s t-test).
Fig. 3
Fig. 3
Differential effects of Rap1 and Rap2 on dendritic development. (a) Camera lucida drawings of representative pairs of spiny neurons transfected with GFP or Rap mutant constructs, as indicated. (b) Total dendritic length per cell in neurons transfected as indicated. Data shown as mean ± SEM. *p < 0.05 versus GFP [one-way anova with Tukey’s Honestly Significant Differences (HSD) post hoc test].
Fig. 4
Fig. 4
Rap2 causes retraction of axons and dendrites. (a–c) Hippocampal neurons were transfected at 10DIV with GFP (a) or Rap2V12 (b, c) and subjected to time-lapse imaging at 1 day after transfection (ai, bi), 3 days after transfection (aii, bii, ci) or 5 days after transfection (cii). Each pair of images (ai/aii, bi/bii and ci/cii) shows the same neuron at different time points. Examples of axonal growth (solid arrow), dendrite growth (solid arrowhead), axonal retraction (open arrow) and dendritic retraction (open arrowhead), are indicated. Scale bar 100 μm.
Fig. 5
Fig. 5
Rap2 causes loss of spines and excitatory synapses. (a, b) Hippocampal neurons were transfected with GFP (a) or Rap2V12 (b) and double-labeled for the respective transfected protein (green; ai, bi) and endogenous PSD-95 (red; aii, bii). Merged image shows overlap of green and red as yellow (aiii, biii). Scale bar 25 μm. Insets: higher-magnification views of dendritic regions indicated by white boxes. (c) Linear density (number per 10 μm, white bars) and total number of PSD-95 clusters per cell (black bars) in GFP- or Rap2V12-transfected neurons. (d) Percentage distribution of PSD-95 puncta in dendritic spines, filopodia or dendritic shaft in transfected neurons from (a) and (b). Data shown as mean ± SEM. *p < 0.05, **p < 0.001 versus control (Student’s t-test).
Fig. 6
Fig. 6
Reduction in AMPA receptor GluR2 by Rap1 and Rap2. (a, c, e) Primary hippocampal neuron cultures were transfected with constructs as indicated to left of images, and immunostained for either exogenous Rap (red, left column) or AMPA receptors (GluR1/R2 surface or total as indicated; green, middle column). Merged images are shown in right column in color. (b, d, f) Quantification of immunofluorescence intensities for each condition in (a), (c) and (e) shown as mean ± SEM of 10 neurons, normalized with respect to non-transfected (Non-txf) control. ***p < 0.005, **p < 0.01 vs. non-transfected (Student’s t-test).
Fig. 7
Fig. 7
Rap activation reduces AMPA receptor mEPSCs and removes synaptic GluR2. (a) Representative traces of AMPA mEPSC recordings from control cells transfected with GFP or cells transfected with Rap2V12 or Rap1V12 as indicated, before (left) and after (right) 5 min exposure to PhTX (10 μm). TTX and BMI were present in all experiments to pharmacologically isolate AMPA mEPSCs. (b, c) Summary of results from (a). Both mean frequency (b) and amplitude (c) of AMPA mEPSCs were unchanged after acute exposure to PhTX in controls but decreased significantly in cells transfected with Rap2V12 or Rap1V12. All data shown represent mean ± SEM; *p < 0.05, **p < 0.005 (Student’s t-test). (d–f) Rap2 alters rectification properties of AMPA receptors. (d) Representative current–voltage (I–V) relationship plotted for a control cell transfected with GFP, showing a nearly linear relationship. Currents were evoked with 100 μm kainate at various holding potentials from − 80 to + 80 mV (at 20-mV increments). (e) A representative current–voltage curve from a cell transfected with Rap2V12 demonstrated strong inward rectification. (f) Summary of rectification ratios (I60/I−60) for the experiments shown in (d) and (e). The rectification ratio was calculated as the ratio of the current amplitude at + 60 mV (I60) to the current amplitude at − 60 mV (I−60). Data are shown as mean ± SEM. *p < 0.05 versus control (Student’s t-test).
Fig. 8
Fig. 8
Synaptic activity antagonizes inhibition of AMPA mEPSCs by Rap. (a) Representative recordings of pharmacologically isolated AMPA receptor-mediated mEPSCs from neurons transfected as indicated, in the presence or absence of BMI for 6 days. (b, c) Quantitation of results from (a). Histograms show mean ± SEM for mEPSC peak amplitude (b) and frequency (c) Number in parenthesis above each bar indicates number of cells recorded for each condition. *p < 0.05 versus GFP; **p < 0.05 versus same construct without BMI; #p = 0.11 versus GFP without BMI (Student’s t-test).
Fig. 9
Fig. 9
Synaptic activity antagonizes dendritic remodeling by Rap2. (a–f) Hippocampal neurons were transfected with GFP (a–c) or Rap2V12 (d–f) and then incubated with 1 μm TTX (b, e) or 100 μm PTX (c, f) for 4 days following transfection, with one treatment immediately following transfection and a second dose administered after 48 h. Scale bar 100 μm. (g) Total dendrite length of Rap2V12-transfected neurons normalized with respect to to GFP controls with same drug treatment. Data shown as mean ± SEM. *p < 0.01, versus Rap2V12 no drug (Student’s t-test).

Similar articles

Cited by

References

    1. Bito H, Furuyashiki T, Ishihara H, Shibasaki Y, Ohashi K, Mizuno K, Maekawa M, Ishizaki T and Narumiya S (2000) A critical role for a Rho-associated kinase, p160ROCK, in determining axon outgrowth in mammalian CNS neurons. Neuron 26, 431–441. - PubMed
    1. Bos JL (1997) Ras-like GTPases. Biochim. Biophys. Acta 1333, M19–M31. - PubMed
    1. Cabib E, Drgonova J and Drgon T (1998) Role of small G proteins in yeast cell polarization and wall biosynthesis. Annu. Rev. Biochem 67, 307–333. - PMC - PubMed
    1. Chen Y, Wang PY and Ghosh A (2005) Regulation of cortical dendrite development by Rap1 signaling. Mol. Cell. Neurosci 28, 215–228. - PubMed
    1. Coleman PD and Yao PJ (2003) Synaptic slaughter in Alzheimer’s disease. Neurobiol. Aging 24, 1023–1027. - PubMed

MeSH terms

Substances

LinkOut - more resources