. 2007 Feb;129(2):121-33.
doi: 10.1085/jgp.200609612. Epub 2007 Jan 16.

The role of S4 charges in voltage-dependent and voltage-independent KCNQ1 potassium channel complexes

Affiliations

The role of S4 charges in voltage-dependent and voltage-independent KCNQ1 potassium channel complexes

Gianina Panaghie et al. J Gen Physiol. 2007 Feb.

Abstract

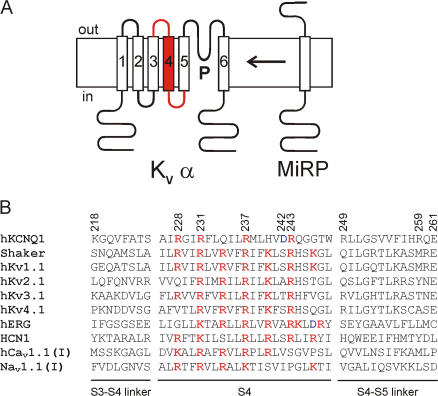
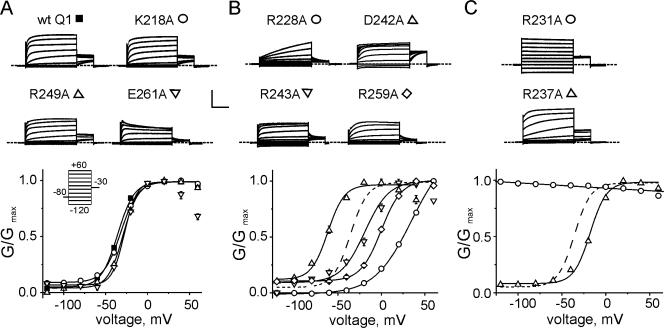
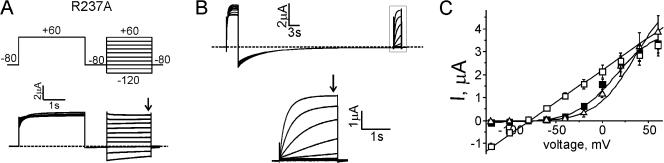
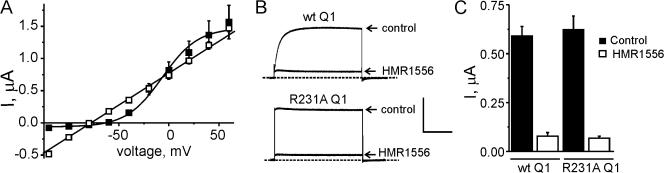
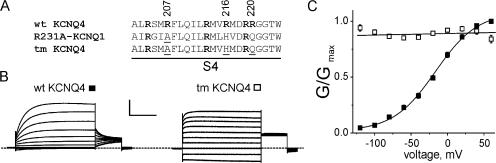
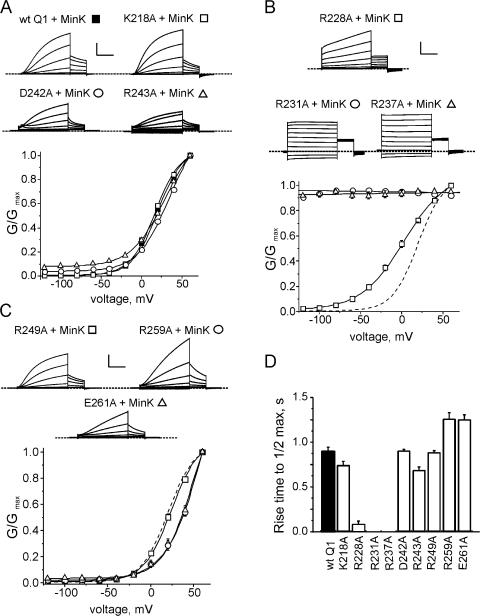
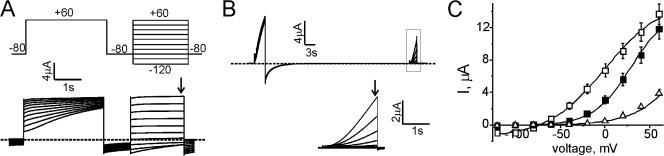
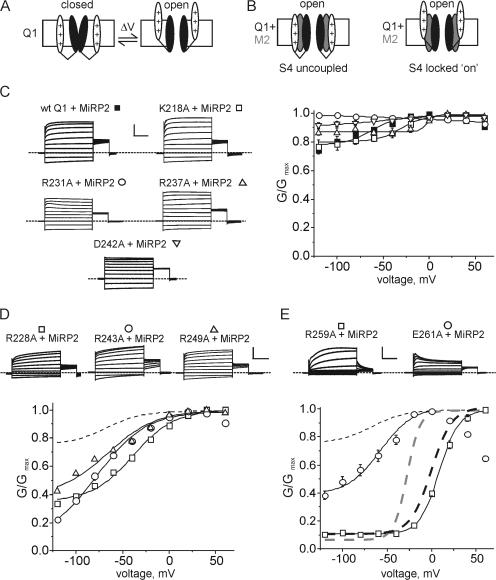
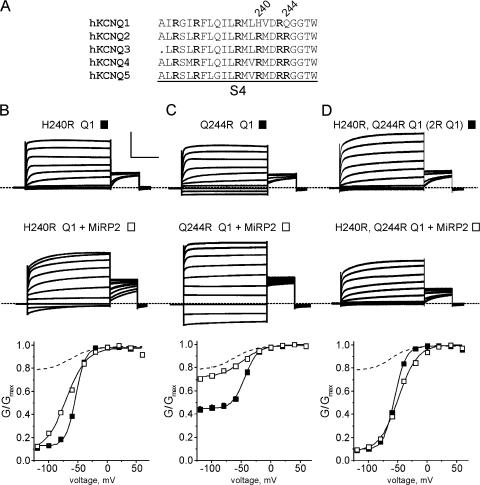
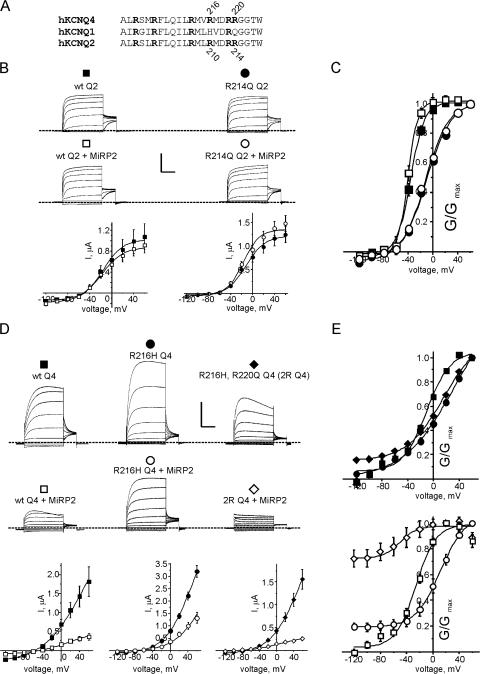
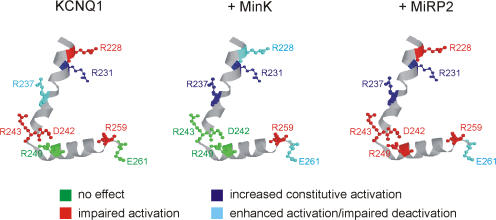
Voltage-gated potassium (Kv) channels extend their functional repertoire by coassembling with MinK-related peptides (MiRPs). MinK slows the activation of channels formed with KCNQ1 alpha subunits to generate the voltage-dependent I(Ks) channel in human heart; MiRP1 and MiRP2 remove the voltage dependence of KCNQ1 to generate potassium "leak" currents in gastrointestinal epithelia. Other Kv alpha subunits interact with MiRP1 and MiRP2 but without loss of voltage dependence; the mechanism for this disparity is unknown. Here, sequence alignments revealed that the voltage-sensing S4 domain of KCNQ1 bears lower net charge (+3) than that of any other eukaryotic voltage-gated ion channel. We therefore examined the role of KCNQ1 S4 charges in channel activation using alanine-scanning mutagenesis and two-electrode voltage clamp. Alanine replacement of R231, at the N-terminal side of S4, produced constitutive activation in homomeric KCNQ1 channels, a phenomenon not observed with previous single amino acid substitutions in S4 of other channels. Homomeric KCNQ4 channels were also made constitutively active by mutagenesis to mimic the S4 charge balance of R231A-KCNQ1. Loss of single S4 charges at positions R231 or R237 produced constitutively active MinK-KCNQ1 channels and increased the constitutively active component of MiRP2-KCNQ1 currents. Charge addition to the CO2H-terminal half of S4 eliminated constitutive activation in MiRP2-KCNQ1 channels, whereas removal of homologous charges from KCNQ4 S4 produced constitutively active MiRP2-KCNQ4 channels. The results demonstrate that the unique S4 charge paucity of KCNQ1 facilitates its unique conversion to a leak channel by ancillary subunits such as MiRP2.


Figures

Figure 1.
Figure 1.
KCNQ1 topology and voltage sensor sequence. (A) The 6 transmembrane (TM) domain topology of Kv α subunits (left) and the 1 TM domain topology of KCNE—encoded ancillary subunits (MiRPs) (right). The S3–S4 linker, S4 domain, and S4–S5 linker are highlighted in red. (B) Sequence alignment for S3–S4 linker, S4, and S4–S5 linker in human Kv, HCN, Cav, and Nav channels. S4 residues are colored: red, positive charges; blue, negative charges. The positions of KCNQ1 charged residues mutated to alanine in this study are indicated at the top.
Figure 2.
Figure 2.
Effects of S4 alanine scanning mutagenesis on homomeric KCNQ1 channel activation. (A–C) Top, exemplar current traces recorded in oocytes expressing wild-type (wt) or alanine mutant KCNQ1 (Q1) channels as indicated, grouped according to their effects on V1/2 of activation (see text for details). Currents were recorded by TEVC using the standard voltage family protocol (inset, A). Bars: vertical, 1 μA (wt Q1, K218A, R259A, R231A), 0.5 μA (R249A, E261A, R228A, D242A, R243A,), 2 μA (R237A); horizontal, 1 s. Zero current level indicated by dashed line. Bottom, normalized G/V relationships obtained by measuring the tail current immediately following the prepulse; n = 9–22. In B and C dashed lines represent wt Q1 for reference. Error bars indicate SEM. Data were fitted with the Boltzmann equation (V1/2 and k values in Table I).
Figure 3.
Figure 3.
Homomeric R237A-KCNQ1 channels deactivate slowly. (A) Exemplar current trace recorded in oocytes injected with R237A-KCNQ1 (Q1) cRNA using a voltage protocol including a depolarizing prepulse followed by a standard voltage family (top). Zero current level indicated by dashed line. (B) Top, exemplar current trace recorded as in A but using a modified protocol with a 40-s hyperpolarizing step at −120 mV before the voltage family. Zero current level indicated by dashed line. Bottom, expanded view of boxed region from trace above. (C) Raw IV relationships measured at the time points indicated by the arrows in A and B (open squares and triangles respectively); n = 5–7. For comparison, the IV relationship for R237A currents recorded using the standard voltage protocol in Fig. 2 (without prior depolarization) is also included (filled squares). Error bars indicate SEM.
Figure 4.
Figure 4.
Properties of the R231A-KCNQ1 leak current. (A) Raw I/V relationships for wild-type KCNQ1 (Q1) (filled squares) and R231A-Q1 (open squares) obtained by measuring the peak current at the end of 3-s voltage steps, for oocytes as in Fig. 2, A and C. (B and C) Effects of Q1 pore blocker HMR1556 on R231A-Q1 current. (B) Exemplar current traces from oocytes injected as indicated and stepped to 0 mV for 3 s from a holding voltage of −80 mV before (control) and after (HMR1556) a 2-min perfusion with 10 μM HMR1556. Bars: vertical, 0.5 μA; horizontal, 1 s. Zero current level indicated by dashed lines. (C) Mean raw current measured at the end of the 3-s depolarizing pulse from traces as in B; n = 8.
Figure 5.
Figure 5.
Charge paucity in KCNQ4 S4 confers constitutive activation. (A) S4 sequence alignment for wild-type (wt) and triple mutant (tm) KCNQ4 versus R231A-KCNQ1. Positively charged amino acids are indicated in bold; mutated resides are underlined. (B) Exemplar current traces recorded in oocytes injected with wt or tm KCNQ4 mutant as indicated. Bars: vertical, 1 μA for wt KCNQ4 and 0.3 μA for tm KCNQ4; horizontal, 1 s. Zero current level indicated by dashed lines. (C) Mean G/V relationships for oocytes as in B obtained by measuring the tail current immediately following the prepulse; n = 10–13. Data for wt KCNQ4 were fitted with the Boltzman equation: V1/2 = −16.7 ± 2.2 mV, k = 28.0 ± 1.8 mV.
Figure 6.
Figure 6.
S4 charge balance dominates the attributes of MinK-KCNQ1 activation. (A) Top, exemplar current traces recorded in oocytes coexpressing wild-type or mutant KCNQ1 (Q1) channels as indicated and MinK. Currents were recorded by TEVC using the standard voltage family protocol (Fig. 2 A). Bars: vertical, 0.5 μA (D242A, R243A), 4 μA (wt Q1, K218A); horizontal, 1 s. Bottom, normalized G/V relationships obtained by measuring the tail current immediately following the prepulse; n = 10–13. Error bars indicate SEM. In all panels, voltage- dependent activation data were fitted with a sigmoidal relationship. (B) Top, exemplar current traces recorded in oocytes coexpressing mutant KCNQ1 (Q1) channels as indicated and MinK. Currents were recorded by TEVC using the standard voltage family protocol (Fig. 2 A). Bars: vertical, 2 μA (R231A), 4 μA (R237A), 6 μA (R228A); horizontal, 1 s. For R231A channels, a 10-fold dilution of cRNA was required to prevent excessive current density. Bottom, normalized G/V relationships obtained by measuring the tail current immediately following the prepulse; n = 6–10. Dashed line represents wt Q1 + MinK for reference. Error bars indicate SEM. (C) Top, exemplar current traces recorded in oocytes coexpressing mutant KCNQ1 (Q1) channels as indicated and MinK. Currents were recorded by TEVC using the standard voltage family protocol (Fig. 2 A). Bars: vertical, 0.5 μA (R259A, E261A), 2 μA (R249A); horizontal, 1 s. Bottom, normalized G/V relationships obtained by measuring the tail current immediately following the prepulse; n = 8–10. Dashed line represents wt Q1 + MinK for reference. Error bars indicate SEM. (D) Activation kinetics expressed as time to reach half-maximal current at +60 mV, for oocytes in A–C; n = 6–13. Error bars indicate SEM.
Figure 7.
Figure 7.
MinK-R228A-KCNQ1 channels deactivate slowly. (A) Exemplar current trace recorded in oocytes injected with R228A-KCNQ1 and MinK cRNA using the indicated voltage protocol (top). Zero current level indicated by dashed line. (B) Top, exemplar current trace recorded in oocytes injected with R228A-KCNQ1 and MinK cRNA using a modified version of the voltage protocol in A, with a 40-s hyperpolarizing step at −120 mV before the voltage family. Zero current level indicated by dashed line. Bottom, expanded view of boxed region from trace above. (C) Raw I/V relationships measured at the time points indicated by the arrows in A and B (open squares and triangles respectively); n = 5–6. For comparison, the I/V relationship for R228A + MinK currents recorded using the standard voltage protocol in Fig. 2 A (without prior depolarization) is also included (filled squares). Error bars indicate SEM.
Figure 8.
Figure 8.
Net charge of S4 and the S4–S5 linker determines extent of constitutive activation of MiRP2-KCNQ1 channels. (A and B) Alternative models to explain (A) the voltage dependence of homomeric KCNQ1 channels versus (B) the voltage independence of MiRP2-KCNQ1 channels. The lipid bilayer is shown in white, with the extracellular side uppermost. (A) In homomeric KCNQ1 channels, the S4 (white with plus signs for net positive charge) is in the down (off) position and thus the gate (black) is closed (left) until depolarization shifts the S4 to the up (on) position, which opens the gate via the S4–S5 linkers (black lines) (right). (B) In MiRP2-KCNQ1 channels, MiRP2 is shown in gray. The gate is always open even at hyperpolarized voltages either because the S4 position is not communicated to the gate (left, S4 uncoupled) or because the S4 is always in the up (on) position regardless of membrane potential (right, S4 locked on). (C) Left, exemplar current traces recorded in oocytes coexpressing wild-type MiRP2 and wild-type or mutant KCNQ1 (Q1) channels as indicated. Currents were recorded by TEVC using the standard voltage family protocol (Fig. 2 A). Bars: vertical, 1 μA except 4 μA for R237A; horizontal, 1 s. Zero current level indicated by dashed lines. Right, normalized G/V relationships obtained by measuring the tail current immediately following the prepulse; n = 6–13. Error bars indicate SEM. Data were fitted with either a straight line or a sigmoidal relationship. (D) Top, exemplar current traces recorded in oocytes coexpressing wild-type MiRP2 and mutant KCNQ1 (Q1) channels as indicated. Currents were recorded by TEVC using the standard voltage family protocol (Fig. 2 A). Bars: vertical, 1 μA except 0.5 μA for R243A; horizontal, 1 s. Zero current level indicated by dashed line. Bottom, normalized G/V relationships obtained by plotting the tail current immediately following the prepulse versus prepulse voltage; n = 10–15. Error bars indicate SEM. Dashed line indicates G/V relationship for wild-type MiRP2-KCNQ1 channels for comparison. Data were fitted with a sigmoidal relationship. (E) Top, exemplar current traces recorded in oocytes coexpressing MiRP2 with either of two S4–S5 linker KCNQ1 mutants as indicated. Bars: vertical, 0.5 μA (R259A) and 0.4 μA (E261A); horizontal, 1 s. Zero current level indicated by dashed line. Bottom, normalized G/V relationships obtained by plotting the tail current immediately following the prepulse versus prepulse voltage; n = 11. For comparison, G/V relationships for oocytes injected with R259A alone (thick black dashed line), E261A alone (gray dashed line), and wt KCNQ1 + MiRP2 (thin black dashed line) are also shown. Error bars indicate SEM. A Boltzmann fit of the G/V relationship for R259A Q1 + MiRP2 gave V1/2 = −56.3 ± 3.3 mV; k = 3.6 ± 1.8 mV. Meaningful quantitative fitting of the E261A G/V relationship was prevented by some constitutive activation and subsequent inactivation.
Figure 9.
Figure 9.
Charge paucity in the CO2H-terminal end of S4 is required for constitutive activation of MiRP2-KCNQ1 channels. (A) S4 sequence alignment for the KCNQ family. Positively charged amino acids are indicated in bold; KCNQ1 lacks positive charges at positions 240 and 244, which are present at equivalent positions in KCNQ2–5. (B–D) Top, exemplar current traces recorded in oocytes injected with KCNQ1 (Q1) variants: (B) H240R Q1, (C) Q244R Q1, or (D) H240R, Q244R Q1 (2R Q1) alone or with MiRP2 as indicated. Bars: vertical, 1 μA; horizontal, 1 s. Zero current level indicated by dashed lines. Bottom, mean normalized G/V relationships for oocytes injected with (B) H240R Q1, (C), Q244R Q1, or (D) H240R, Q244R Q1 (2R Q1) alone (filled squares) or with MiRP2 (open squares); n = 10–15. Dashed lines indicate G/V relationship for wild-type MiRP2-KCNQ1 channels for comparison. Error bars indicate SEM. G/V relationships when constitutive activation was <20% were fitted with the Boltzmann equation. Values were as follows: H240R Q1, V1/2 = −53.5 ± 0.5 mV, k = 8.2 ± 0.5 mV; H240R Q1 + MiRP2, V1/2 = −69.0 ± 3.4 mV, k = 17.9 ± 2.8 mV, (significant difference in V1/2 with/without MiRP2; P < 0.001). 2R Q1, V1/2 = −54.88 ± 0.49 mV, k = 9.6 ± 0.3 mV; 2R Q1 + MiRP2, V1/2 = −48.46 ± 0.6 mV, k = 16 ± 0.5 mV (significant difference in k with/without MiRP2; P < 0.001).
Figure 10.
Figure 10.
Charge paucity in the CO2H-terminal end of S4 endows constitutive activation upon MiRP2-KCNQ4 channels. (A) S4 sequence alignment for KCNQ1, 2, and 4. Basic amino acids are indicated in bold; KCNQ1 lacks positive charges at positions 240 and 244; these are present at equivalent positions in KCNQ2 and 4 (numbered accordingly) and were mutated to mimic the KCNQ1 S4 for experiments in B–E. (B) Top, exemplar current traces recorded in oocytes injected with wild-type (wt) or R214Q KCNQ2 (Q2) alone or with MiRP2 as indicated. Bars: vertical, 0.5 μA; horizontal, 1 s. Zero current level indicated by dashed lines. Bottom, mean I/V relationships for oocytes as above; n = 8–11. Error bars indicate SEM. (C) Mean G/V relationships for oocytes injected as in B, symbols as in B; n = 8–11. Error bars indicate SEM. Data were fitted with the Boltzmann equation; values were as follows: wild-type Q2, V1/2 = −36.2 ± 1.4 mV, k = 11.0 ± 1.0 mV, A1 = −0.01 ± 0.01, A2 = 1.0 ± 0.01; wild-type Q2 + MiRP2, V1/2 = −40.8 ± 1.4 mV, k = 8.0 ± 1.3 mV, A1 = −0.02 ± 0.01, A2 = 1.02 ± 0.01; R214Q-Q2, V1/2 = −11.1 ± 1.0 mV, k = 20.1 ± 0.9 mV, A1 = −0.06 ± 0.01, A2 = 1.02 ± 0.01; R214Q-Q2 + MiRP2, V1/2 = −12.1 ± 1.3 mV, k = 18.4 ± 1.0 mV, A1 = −0.04 ± 0.01, A2 = 1.0 ± 0.01. (D) Top, exemplar current traces recorded in oocytes injected with wild-type (wt) KCNQ4 (Q4), R216H-KCNQ4, or double mutant R216H, R220Q-KCNQ4 (2R Q4) alone (top) or with MiRP2 (bottom) as indicated. Bars: (top traces) vertical, 1 μA; horizontal, 1 s; (bottom traces) vertical, 0.5 μA; horizontal, 1 s. Zero current level indicated by dashed lines. Bottom panels, mean I/V relationships for oocytes as above; n = 8–11. Error bars indicate SEM. (E) Mean G/V relationships for oocytes injected as in D, symbols as in D; n = 8–11. Error bars indicate SEM. Data were fitted with the Boltzmann equation; values were as follows: wild-type Q4, V1/2 = −10.6 ± 1.6 mV, k = 18.3 ± 1.5 mV, A1 = 0.06 ± 0.02, A2 = 1.05 ± 0.02; wild-type Q4 + MiRP2, V1/2 = −25.9 ± 2.1 mV, k = 15.4 ± 1.8 mV, A1 = 0.03 ± 0.02, A2 = 0.99 ± 0.03; R216H-Q4, V1/2 = 33.8 ± 10.3 mV, k = 40.3 ± 4.5 mV, A1 = 0.0 ± 0.01, A2 = 1.5 ± 0.2; R216H-Q4 + MiRP2, V1/2 = −11.6 ± 4.2 mV, k = 19.0 ± 3.6 mV, A1 = 0.19 ± 0.02, A2 = 1.06 ± 0.1; 2R Q4, V1/2 = 16.1 ± 2.5 mV, k = 28.9 ± 2.0 mV, A1 = 0.15 ± 0.01, A2 = 1.19 ± 0.04; 2R Q4 + MiRP2, V1/2 = −52.1 ± 14.3 mV, k = 12.5 ± 11.9 mV, A1 = 0.73 ± 0.1, A2 = 0.98 ± 0.02.
Figure 11.
Figure 11.
Summary of effects of charge perturbation in KCNQ1 S4. The KCNQ1 S4 and S4–S5 linker domains modeled on the Kv1.2 three-dimensional structure using SWISS-MODEL. The charged amino acids studied within are labeled and color coded according to their effects on the amount of constitutive current in KCNQ1 (left), MinK-KCNQ1 (center), and MiRP2-KCNQ1 (right) channels. Positions are color coded depending upon the relative activation properties of the less positively charged of the two variants tested at each position (alanine when basic residues were mutated, or the native residue when acidic residues were mutated). Thus, green indicates positions at which the less positively charged variant had no effect on activation; red indicates impaired activation; dark blue indicates increased constitutive activation; light blue indicates other enhancements of activation (left shifted voltage dependence) or slowed deactivation.

Similar articles

Cited by

References

    1. Abbott, G.W., M.H. Butler, S. Bendahhou, M.C. Dalakas, L.J. Ptacek, and S.A. Goldstein. 2001. MiRP2 forms potassium channels in skeletal muscle with Kv3.4 and is associated with periodic paralysis. Cell. 104:217–231. - PubMed
    1. Abbott, G.W., F. Sesti, I. Splawski, M.E. Buck, M.H. Lehmann, K.W. Timothy, M.T. Keating, and S.A. Goldstein. 1999. MiRP1 forms IKr potassium channels with HERG and is associated with cardiac arrhythmia. Cell. 97:175–187. - PubMed
    1. Aggarwal, S.K., and R. MacKinnon. 1996. Contribution of the S4 segment to gating charge in the Shaker K+ channel. Neuron. 16:1169–1177. - PubMed
    1. Barhanin, J., F. Lesage, E. Guillemare, M. Fink, M. Lazdunski, and G. Romey. 1996. K(V)LQT1 and lsK (minK) proteins associate to form the I(Ks) cardiac potassium current. Nature. 384:78–80. - PubMed
    1. Grahammer, F., A.W. Herling, H.J. Lang, A. Schmitt-Graff, O.H. Wittekindt, R. Nitschke, M. Bleich, J. Barhanin, and R. Warth. 2001. The cardiac K+ channel KCNQ1 is essential for gastric acid secretion. Gastroenterology. 120:1363–1371. - PubMed

Publication types

MeSH terms