

Incorporating quality of evidence into decision analytic modeling
- PMID: 17227937
- PMCID: PMC3460380
- DOI: 10.7326/0003-4819-146-2-200701160-00008
Incorporating quality of evidence into decision analytic modeling
Abstract
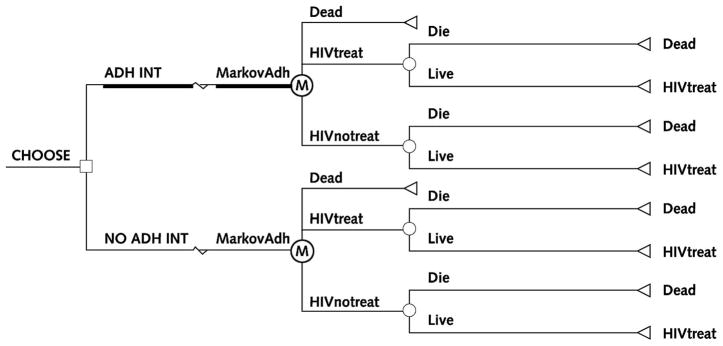
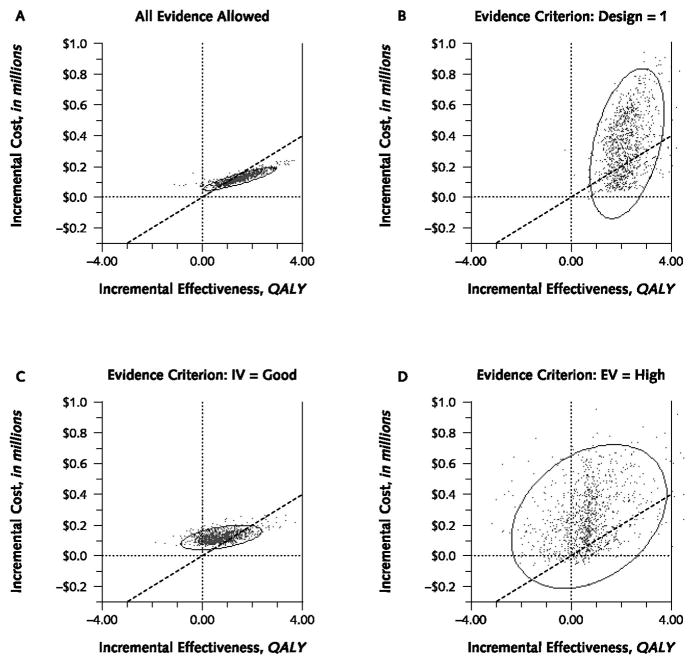
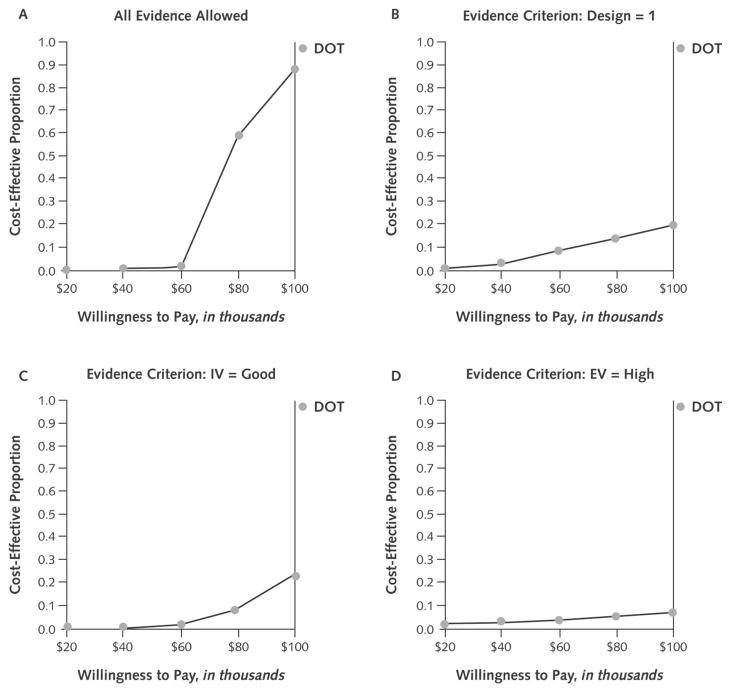
Our objective was to illustrate the effects of using stricter standards for the quality of evidence used in decision analytic modeling. We created a simple 10-parameter probabilistic Markov model to estimate the cost-effectiveness of directly observed therapy (DOT) for individuals with newly diagnosed HIV infection. We evaluated quality of evidence on the basis of U.S. Preventive Services Task Force methods, which specified 3 separate domains: study design, internal validity, and external validity. We varied the evidence criteria for each of these domains individually and collectively. We used published research as a source of data only if the quality of the research met specified criteria; otherwise, we specified the parameter by randomly choosing a number from a range within which every number has the same probability of being selected (a uniform distribution). When we did not eliminate poor-quality evidence, DOT improved health 99% of the time and cost less than 100,000 dollars per additional quality-adjusted life-year (QALY) 85% of the time. The confidence ellipse was extremely narrow, suggesting high precision. When we used the most rigorous standards of evidence, we could use fewer than one fifth of the data sources, and DOT improved health only 49% of the time and cost less than 100,000 dollars per additional QALY only 4% of the time. The confidence ellipse became much larger, showing that the results were less precise. We conclude that the results of decision modeling may vary dramatically depending on the stringency of the criteria for selecting evidence to use in the model.
Conflict of interest statement
Figures
References
-
- Neumann PJ. Why don’t Americans use cost-effectiveness analysis? Am J Manag Care. 2004;10:308–12. - PubMed
-
- Doubilet P, Begg CB, Weinstein MC, Braun P, McNeil BJ. Probabilistic sensitivity analysis using Monte Carlo simulation. A practical approach. Med Decis Making. 1985;5:157–77. - PubMed
-
- Claxton K, Sculpher M, McCabe C, Briggs A, Akehurst R, Buxton M, et al. Probabilistic sensitivity analysis for NICE technology assessment: not an optional extra. Health Econ. 2005;14:339–47. - PubMed
-
- Harris RP, Helfand M, Woolf SH, Lohr KN, Mulrow CD, Teutsch SM, et al. Current methods of the US Preventive Services Task Force: a review of the process. Am J Prev Med. 2001;20:21–35. - PubMed
-
- Guyatt GH, Haynes RB, Jaeschke RZ, Cook DJ, Green L, Naylor CD, et al. Users’ Guides to the Medical Literature: XXV. Evidence-based medicine: principles for applying the Users’ Guides to patient care. Evidence-Based Medicine Working Group. JAMA. 2000;284:1290–6. - PubMed
Publication types
MeSH terms
Grants and funding
LinkOut - more resources
Full Text Sources
Other Literature Sources
Miscellaneous